 |
VOOZH | about |
|
VOOZH | about |
Ensuring data quality and reliability is crucial for making informed decisions and extracting meaningful insights. However, datasets often contain irregularities known as outliers, which can significantly impact the integrity and accuracy of analyses. This makes outlier detection a crucial task in data analysis.
Outliers are data point that is essentially a statistical anomaly, a data point that significantly deviates from other observations in a dataset. Outliers can arise due to measurement errors, natural variation, or rare events, and they can have a disproportionate impact on statistical analyses and machine learning models if not appropriately handled.
Example: If you have the following dataset of student test scores:
[85, 87, 90, 88, 92, 89, 45]The score 45 is an outlier—it’s much lower than the others.
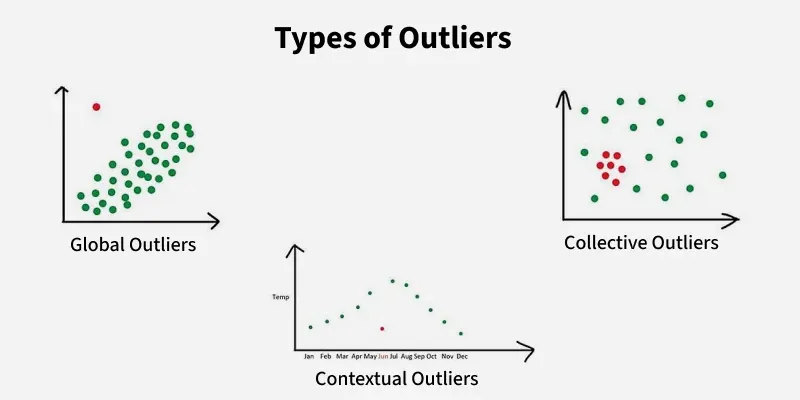
Note: Outliers can be valid observations or errors in data entry, mesurement, or processing.Outliers can be classified into various types based on their characteristics:
👁 types_of_outliersOutlier detection is a process of identifying observations or data points that significantly deviate from the majority of the data.
Outliers can distort statistical analyses, leading to erroneous conclusions and misleading interpretations. When calculating means, medians, or standard deviations, outliers can exert disproportionate influence, skewing the results and undermining the validity of the analysis. By detecting and appropriately addressing outliers, analysts can mitigate the impact of these anomalies on statistical measures, ensuring that the insights drawn from the data are representative and accurate.
Detecting outliers is critical for numerous reasons:
Outlier detection is a critical task in data analysis, crucial for ensuring the quality and reliability of conclusions drawn from data. Different techniques are tailored for varying data types and scenarios, ranging from statistical methods for general data sets to specialized algorithms for spatial and temporal data. Some techniques are:
Standard Deviation Method is based on the assumption that the data follows a normal distribution. Data points outside of three standard deviations from the mean are considered outliers.
It is commonly used for univariate data analysis where the distribution can be assumed to be approximately normal.
Example: Dataset: [1, 2, 2, 3, 1, 3, 10]. Find an outlier using the Standard Deviation Method.
Mean,
Standard Deviation,
Lower and upper bounds for outliers:
- Lower bound = 3.142857 - 2 X 2.917 3.142857 - 5.834 = -2.691
- Upper bound = 3.142857 + 2 X 2.917 3.142857 + 5. 834 = 8.977
Any values outside [-2.691, 8.977] is an outlier, thus 10 is an outlier.
So, the data point 10 is identified as an outlier using the Standard Deviation Method.
The Interquartile Range (IQR) method focuses on the spread of the middle 50% of data. It calculates the IQR as the difference between the 75th and 25th percentiles of the data and identifies outliers as those points that fall below 1.5 times the IQR below the 25th percentile or above 1.5 times the IQR above the 75th percentile. This method is robust to outliers and does not assume a normal distribution.
It is suitable for datasets with skewed or non-normal distributions. Useful for identifying outliers in datasets where the spread of the middle 50% of the data is more relevant than the mean and standard deviation.
Example: Dataset X = {3,5,7,9,11,13,30}, find outlier using the IQR method.
- Q1 (25th percentile): Median of first half = Median of
[3, 5, 7]= 5- Q3 (75th percentile): Median of second half = Median of
[11, 13, 30]= 13IQR = Q3 − Q1 = 13 − 5 = 8
Lower Bound: Q1 - 1.5 × IQR = 5 - 1.5 × 8 = 5 - 12 = -7
Upper Bound: Q3 + 1.5 × IQR = 13 + 1.5 × 8 =13 + 12 = 25
Therfore the interval is -7 to 25. 30 lies outside the interval, therefore is an outlier.
The Z-score method calculates the number of standard deviations each data point is from the mean. A Z-score threshold is set, commonly 3, and any data point with a Z-score exceeding this threshold is considered an outlier. This method assumes a normal distribution and is sensitive to extreme values in small datasets.
Suitable for datasets with large sample sizes and where the underlying distribution of the data can be reasonably approximated by a normal distribution.
Example: X={4,5,5,6,7,8,20}, find outlier using the Z-score method.
Mean,
Standard Deviation,
Z-scores:
Z-score for all data points: 4: -0.72, 5: -0.53, 5: -0.53, 6: -0.35, 7: -0.16, 8: 0.03, 20: 2.26
Threshold Z > 2 := 20 is an outlier since |2.26| > 2
The choice of outlier detection technique depends on the characteristics of the data, the underlying distribution, and the specific requirements of the analysis.
Detecting outliers effectively poses several challenges:
Outlier detection plays a crucial role across various domains, enabling the identification of anomalies that can indicate errors, fraud, or novel insights. Here are some key applications of outlier detection with specific examples: