 |
VOOZH | about |
|
VOOZH | about |
Outlier detection is an important task in data as identifying outliers can help us to understand the data better and improve the accuracy of our models. One common technique for detecting outliers is Z score. It is a statistical measurement that describes how far a data point is from the mean, expressed in terms of standard deviations. It helps us to identify if a data point is relatively higher or lower than the mean and how far it deviates from the average value.
Where:
Outlier can be detected using Z-scores as follows:
Commonly, data points with a Z-score greater than 3 or less than -3 are considered outliers as they lie more than 3 standard deviations away from the mean. This threshold can be adjusted based on the dataset and the specific needs of the analysis.
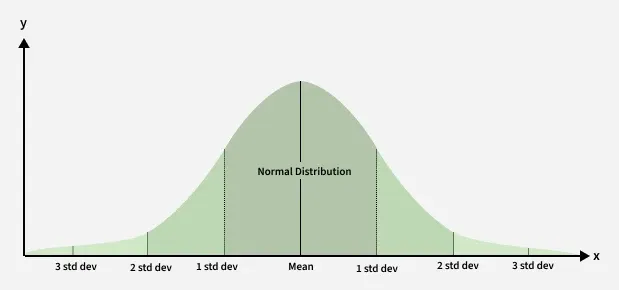
Z-Score is useful for detecting outliers in normal distribution, as it highlights data points that lie far from the mean. A normal distributionis shown below and it is estimated that 68% of the data points lie between +/- 1 standard deviation. 95% of the data points lie between +/- 2 standard deviation 99.7% of the data points lie between +/- 3 standard deviation
For example, in a survey, it was asked how many children a person had. Suppose the data obtained from people is
1, 2, 2, 2, 3, 1, 1, 15, 2, 2, 2, 3, 1, 1, 2
Here, the value 15 is clearly an outlier as it deviates significantly from the other data points. The Z-Score for this data point will be much higher than the rest, showing it as an anomaly.
Lets see why it works so well:
Let’s see the steps of detecting outliers using the Z-Score method in Python.
We will be importing numpy, pandas, scipy and matplotlib for calculating the Z-Score and visualizing the outliers.
For this example, we will use sample data and convert this into a pandas DataFrame.
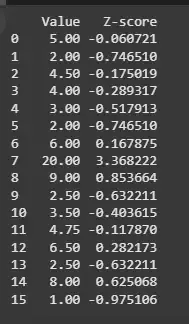
Now, we calculate the Z-scores for this dataset using the z-score function from scipy.stats.
Output:
This give us the Z-Score for each data point in the dataset.
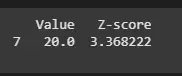
Next, we'll identify the data points that have a Z-score greater than 3 or less than -3 which are commonly considered outliers.
Output:
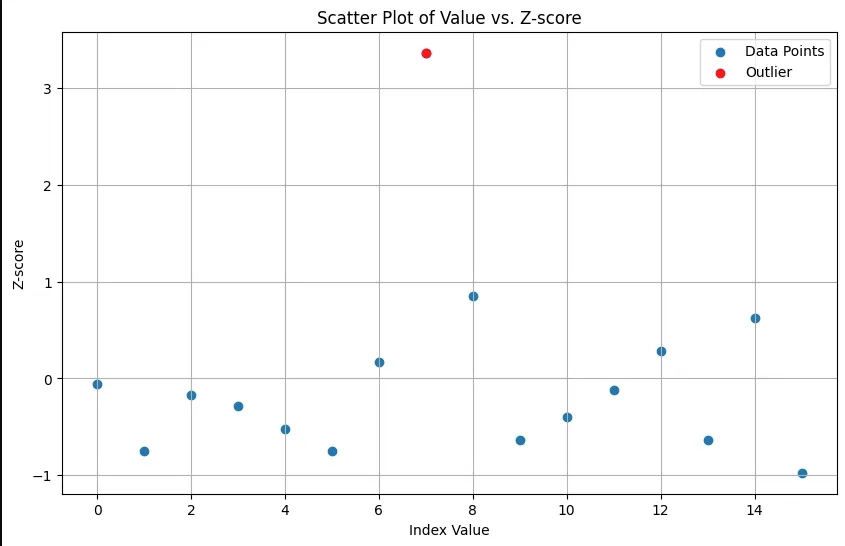
To better understand the outliers, let’s create a scatter plot to visualize the dataset and highlight the outliers.
Output:
In this case, the value 20 is an outlier because its Z-score is significantly higher than the rest of the values in the dataset.
While Z-Score is effective, there are a few important considerations:
By applying the Z-score method, we can quickly identify and deal with outliers which improves the accuracy of our data analysis and statistical models.