 |
VOOZH | about |
|
VOOZH | about |
Outliers are observations that deviate significantly from the overall pattern of a dataset and this deviation can lead to poor results in analysis. Interquartile Range (IQR) is a technique that detects outliers by measuring the variability in a dataset. In this article we will learn about it.
IQR is used to measure variability by dividing a data set into quartiles. The data is sorted in ascending order and then we split it into 4 equal parts. The values Q1 (25th percentile), Q2 (50th percentile or median) and Q3 (75th percentile) separate dataset in 4 equal parts.
If a dataset has 2n or 2n+1 data points, then
The IQR is calculated as: IQR=Q3−Q1 = Q3 - Q1
Data points that fall below Q1−1.5×IQR or above Q3+1.5×IQR are considered outliers.
Example:
Assume the below data:
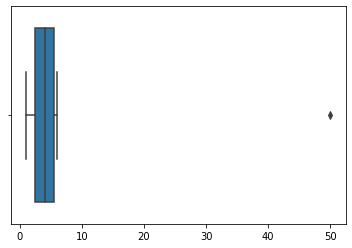
6, 2, 1, 5, 4, 3, 50.
If these values represent the number of chapatis eaten in lunch then 50 is clearly an outlier. Let’s use Python to detect it.
Step 1: Import necessary libraries.
Step 2: Sorting data in ascending order.
Output:
array([ 1, 2, 3, 4, 5, 6, 50])
Step 3: Calculating Q1, Q2, Q3 and IQR.
Output:
Q1 25 percentile of the given data is, 2.5
Q1 50 percentile of the given data is, 4.0
Q1 75 percentile of the given data is, 5.5
Interquartile range is 3.0
Step 4: Find the lower and upper limits.
Output:
low_limit is -2.0
up_limit is 10.0
Step 5: Identify the outliers.
Output:
outlier in the dataset is [50]
Step 6: Plot the box plot to highlight outliers.
👁 ImageThis method along with visualizing data through box plots ensures more reliable and robust data preprocessing.