 |
VOOZH | about |
|
VOOZH | about |
Outliers are data points that differ significantly from the rest of the dataset and do not follow the general pattern. They can occur due to errors, rare events or natural variability in data.
Outliers can occur due to a variety of reasons. Identifying their source is crucial for accurate data analysis
Outliers can appear in various forms depending on how they deviate from the data and the context in which they occur. Each type presents distinct challenges for detection and interpretation.
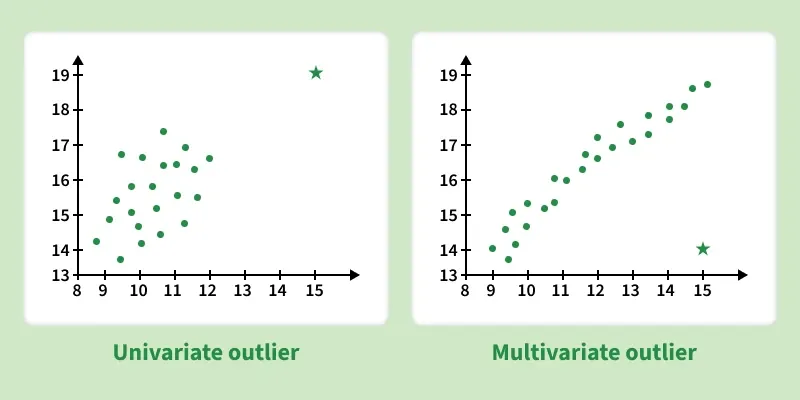
Univariate outliers are extreme values in a single variable that differ significantly from the rest of the data. For example in a dataset of adult heights where most values range between 5.5 and 6 feet, a height of 7 feet would be considered a univariate outlier.
Multivariate outliers involve unusual combinations of values across multiple variables. For instance when analyzing both height and weight an individual who is exceptionally tall and unusually heavy compared to others may be considered a multivariate outlier, even if each value alone appears reasonable.
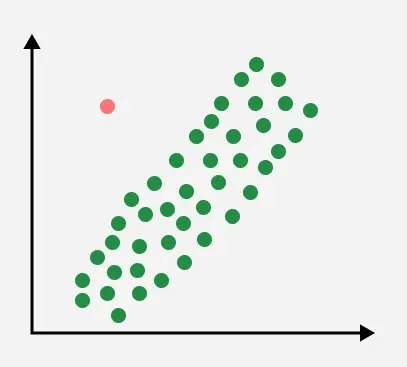
Point outliers also known as global outliers are individual data points that lie far away from the majority of observations in the dataset. These are the simplest type of outliers and are commonly targeted by most detection methods. For example, extremely high household energy consumption compared to others may indicate a global outlier.
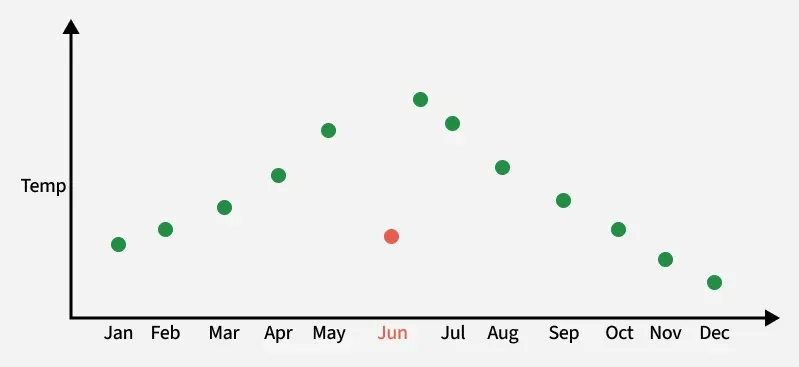
Contextual outliers are data points that appear abnormal only under specific conditions or contexts. For example, a very low temperature may be normal during winter but considered an outlier in summer. These outliers depend on contextual attributes such as time, location or environmental conditions.
Contextual outlier detection considers both contextual attributes (e.g., season, time, location) and behavioral attributes (e.g., temperature, humidity, pressure). This approach allows for flexible and meaningful outlier detection across varying conditions.
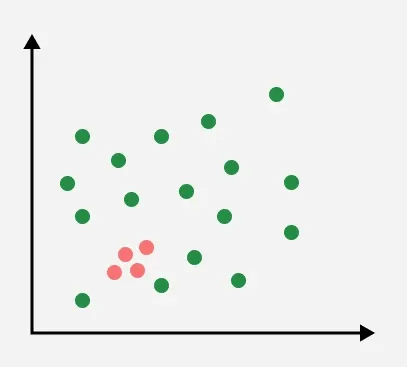
Collective outliers occur when a group of data points collectively deviates from normal behavior, even if individual points are not extreme on their own. This type often indicates a shift in data patterns or emerging phenomena, such as a sudden sequence of unusual network activities.
Outlier detection is an essential step in data analysis as it helps identify abnormal observations that may arise due to measurement errors, data entry mistakes or genuine rare events. These unusual values can significantly influence statistical results and model performance, making their identification critical before further analysis.
Visualization based methods provide an intuitive understanding of data distribution and allow analysts to easily spot extreme or abnormal values.
A. Identifying Outliers Using Box Plots
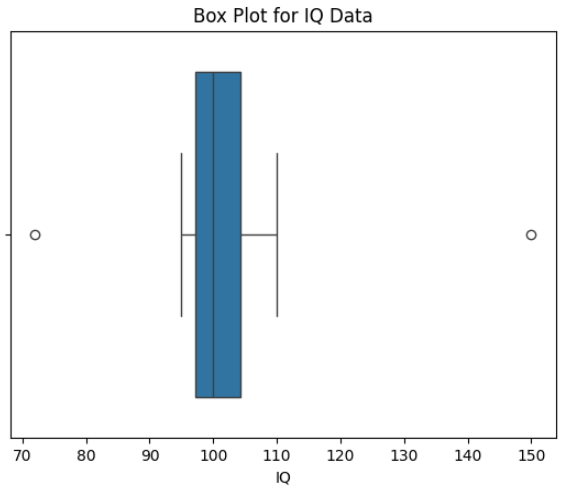
Box plots visually summarize the distribution of a dataset using the median, quartiles and interquartile range (IQR). Any data points lying beyond the whiskers typically defined as 1.5 times the IQR from the first or third quartile are considered potential outliers.
This method is especially effective for quickly identifying extreme values in a single variable.
Output:
The box plot shows outliers as points beyond the whiskers, with 72 and 150 indicating unusually low and high IQ values.
B. Identifying Outliers Using Scatter Plots
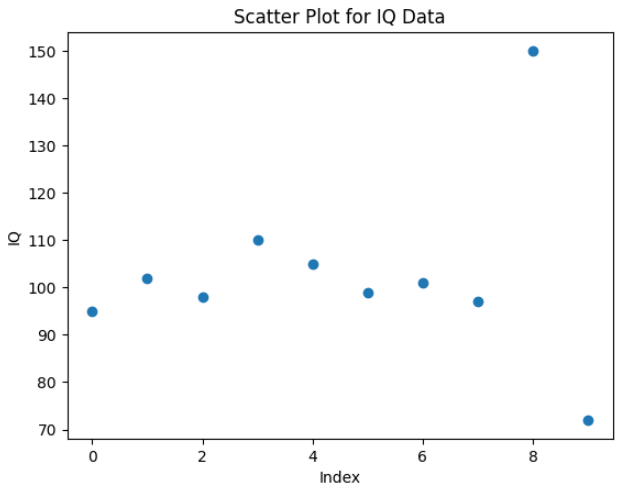
Scatter plots serve as vital tools in figuring out outliers inside datasets mainly when exploring relationships between two non-stop variables. These visualizations plot person facts points as dots on a graph, with one variable represented on each axis.
Outliers in scatter plots often take place as factors that deviate extensively from the overall sample or fashion discovered most of the majority of statistics factors.
Output:
This scatter plot shows most IQ values clustered around 95–110 while the points near 72 and 150 stand out clearly as outliers compared to the rest of the data.
Statistical methods identify outliers by measuring how far data points deviate from the overall distribution using mathematical thresholds.
A. Identifying Outliers Using Z-Score
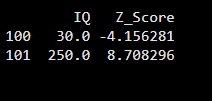
The Z-score method measures how many standard deviations a data point is from the mean of the dataset. Values with Z-scores greater than +3 or less than −3 are commonly treated as outliers making this approach suitable for normally distributed data.
Output:
The output shows that IQ values 30 and 250 lie far from the mean with Z-scores beyond . This indicates they are extreme outliers significantly different from the rest of the data.
B. Identifying Outliers Using the IQR Method
The IQR method defines outliers as values that fall below Q1 − 1.5 × IQR or above Q3 + 1.5 × IQR. Since it does not assume a normal distribution this technique is robust and widely used in real-world datasets.
Output:
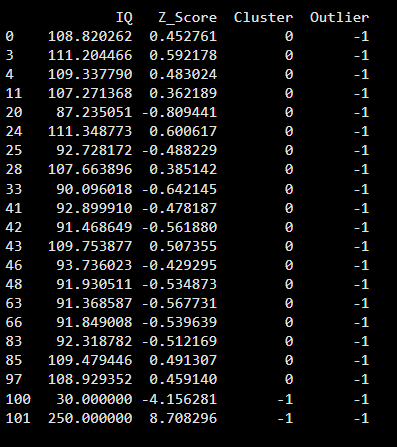
C. Identifying Outliers Using DBSCAN
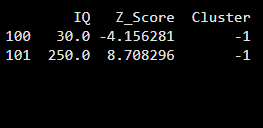
DBSCAN detects outliers by grouping dense regions of data and labeling points that do not belong to any cluster as noise. This density-based approach is effective for datasets with irregular shapes and varying densities.
Output:
This output shows that IQ values 30 and 250 are labeled as noise (Cluster = −1) by DBSCAN,
D. Identifying Outliers Using Isolation Forest
Isolation Forest detects outliers by isolating data points using random decision trees. Anomalies are separated with fewer splits because they are rare and different from normal data. This makes the method fast, scalable, and effective for high-dimensional datasets.
Output:
This output shows that Isolation Forest flags the most unusual IQ values as outliers (Outlier = −1) by isolating them from the normal data distribution
You can download full code from here
Once outliers are detected the next step is deciding how to handle them. The approach depends on the cause of the outlier, the size of the dataset and the goal of the analysis. Common strategies include:
Transforming data can reduce the impact of extreme values. Common transformations include:
This method is useful when preserving all data points is important but their influence needs moderation.
Dropping outliers should be done cautiously and only when there is clear evidence that they result from errors rather than real observations. While some outliers arise from data entry or measurement mistakes others represent meaningful rare events so their cause must be carefully examined before removal.