 |
VOOZH | about |
|
VOOZH | about |
The Box-Cox transformation is a set of power transformations made to stabilize variance and make data more normally distributed, which is required in many statistical techniques like linear regression, ANOVA, and time series modeling.
Statistical models such as linear regression rely on certain assumptions:
However, real-world data often violates these conditions. For example, income and sales data are usually skewed, variance can increase with values, and relationships may be non-linear.
The Box-Cox transformation addresses these issues by reshaping data to be more normal, stabilizing variance, and making relationships between variables more linear. This improves the accuracy and reliability of statistical models.
Let be a positive response variable. The Box-Cox transformation is defined as:
Where:
The choice of λ determines the transformation:
λ Value | Transformation Type |
|---|---|
-2 | Reciprocal square |
-1 | Reciprocal |
-0.5 | Reciprocal square root |
0 | Natural log (ln y) |
0.5 | Square root |
1 | No transformation (identity) |
2 | Square |
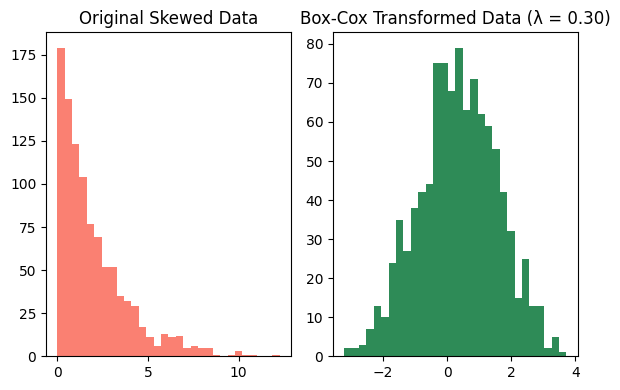
Python implementation where skewed data, generated from an exponential distribution, is transformed using the Box-Cox method to approximate a normal distribution. This transformation is then visualized through histograms to illustrate the effect on the data's shape and symmetry.
Loads NumPy for data, SciPy for the Box-Cox function, and Matplotlib for plotting.
Creates 1000 samples of skewed data from an exponential distribution.
Transforms the skewed data into a more normal shape and returns the best λ (lambda) value.
Plots a histogram of the original skewed data.
Plots a histogram of the transformed data to show improved symmetry (closer to normal distribution).
Output:
This shows how Box-Cox transforms a right-skewed distribution into a more symmetric (normal-like) distribution.
If data includes zero or negative values, consider the Yeo-Johnson transformation, which extends Box-Cox to those cases.