 |
VOOZH | about |
|
VOOZH | about |
The histogram is old method used to plot the attributes in a graph. Histo means to plot and gram means chart. So basically histogram is a graph of the poles. It is one of the effective methods to summarize the distribution of a given attribute.
If the attribute is nominal, then a vertical bar is plotted for every known value of the attribute, in which the height of the bar indicates the count/frequency of that attribute. Graph is more precisely called as bar chart.
If attribute is numeric , then the range of the values are divided into disjoint but consecutive partitions . Each such range can be termed as buckets/bins. The range of every bucket is called width. Each bucket has nearly equal width. For example for the price attribute having values 1 to 100, can be divided into bins of 1 to 25, 25 to 50 and so on. for every subrange, a bar is plotted having the height that counts total no of items in that subrange.
Discretization is one form of data transformation technique. It transforms numeric values to interval labels of conceptual labels. Ex. age can be transformed to (0-10,11-20....) or to conceptual labels like youth, adult, senior.
There are different techniques of discretization:
Histogram analysis is unsupervised learning because it doesn't use any class information like binning. There are various partition rules used to define histograms. In equal width histogram, values are partitioned in equal size bins or ranges. in our earlier example, we have created bin of size 25, which is an equal-width histogram. In equal frequency histogram, partition is done in such a way that every bucket contains same number of data tuples.
Histogram algorithm can be applied to every partition recursively to create a concept hierarchy until the predefined levels are generated. or a minimum interval size is used to control the recursive procedure. It will specify a minimal width of a partition or minimum number of values for each partition at every level
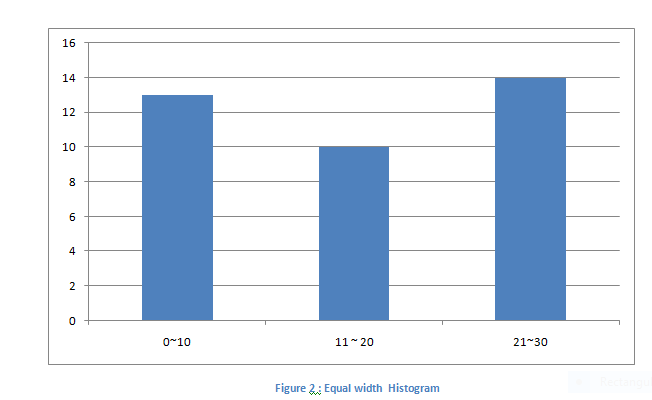
Example: The following data shows the price of commonly sold items in sorted order: 1,1,4,4,4,4,7,7,9,9,9,9,9,11, 13,13,13,17,17,17,17,17,17, 21, 21, 21, 21, 25, 25, 25, 25, 25, 28, 28, 30,30, 30.
Following figure shows histogram for the current data:
Now, we will partition into equal width bins where every bucket has same size width of 10.
Histograms are very effective technique of data reduction which can work on sparse and dense data as well as uniform and highly skewed data. Multidimensional histograms can be used to capture data up to five attributes and are effective in determining dependencies between attributes.
A discretization is important because it is useful: