 |
VOOZH | about |
|
VOOZH | about |
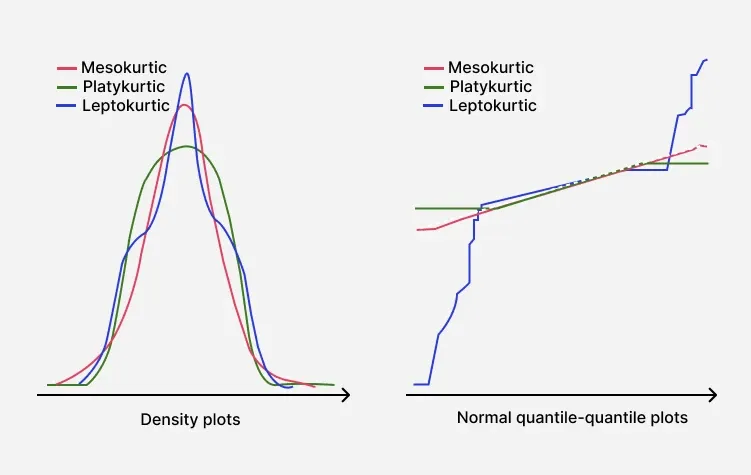
Kurtosis is a statistical parameter characterizing the shape of a probability distribution, and it focuses on the behavior of its tails. Kurtosis determines if a distribution has extreme values more or less than a normal distribution. Distributions are differentiated based on kurtosis as leptokurtic, mesokurtic and platykurtic. A platykurtic distribution will have lighter tails than a normal distribution, with fewer extreme values and a more level spread of data. This means that extreme deviations from the mean are less likely to be seen.
Kurtosis is defined as the fourth central moment of a distribution, standardized by the square of the variance. The mathematical formula for kurtosis is:
Where:
A platykurtic distribution possesses a kurtosis of less than 3 (the kurtosis of the normal distribution). This means that the distribution will have flatter peaks and more slender tails than a normal (Gaussian) distribution. Key characteristics include:
1. Flatter Peak: The peak of the distribution is broader and less pronounced, suggesting that most values lie closer to the mean.
2. Thin Tails: The tails of the distribution taper off quickly, indicating fewer extreme values or outliers in the data.
3. Low Kurtosis Value: Since the kurtosis value is less than 3, the distribution shows less probability of producing extreme deviations.
4. Even Distribution: The spread of values tends to be more uniform across the range, resulting in a more consistent pattern of observations.
1. Uniform Distribution: The uniform distribution is a very typical platykurtic distribution in which all the outcomes have similar probabilities, and the tails are very thin.
2. Beta Distribution (Certain Parameters):If the beta distribution is parameterized for certain parameters that build flat peaks, this will cause it to have a platykurtic shape.
3. Binomial Distribution (Large n, p near 0.5): In cases where the binomial distribution approximates a uniform-like spread, it can exhibit platykurtic behavior.
A platykurtic distribution has a kurtosis value:
Kurtosis < 3
If we consider a dataset with observed values, the kurtosis can be computed using Python.
Output
Kurtosis: -1.0080
The distribution is platykurtic (low kurtosis).
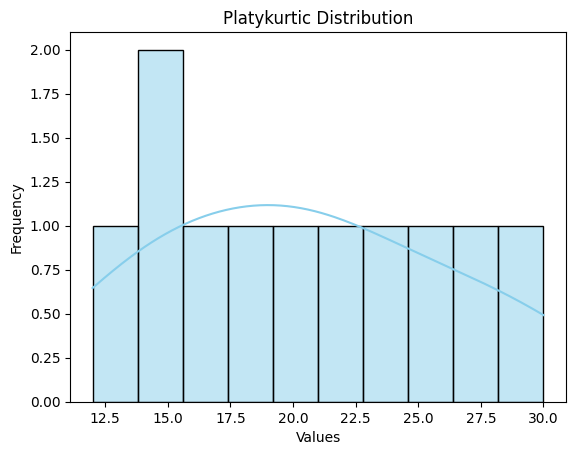
To visualize a platykurtic distribution, you can plot the data to observe its flat peak and thin tails:
Output
Distribution Type | Kurtosis Value | Tails | Peak Shape |
|---|---|---|---|
Leptokurtic | > 3 | Heavy tails | Sharp, narrow peak |
Mesokurtic | = 3 | Normal tails | Bell-shaped peak |
Platykurtic | < 3 | Light tails | Flatter, broad peak |