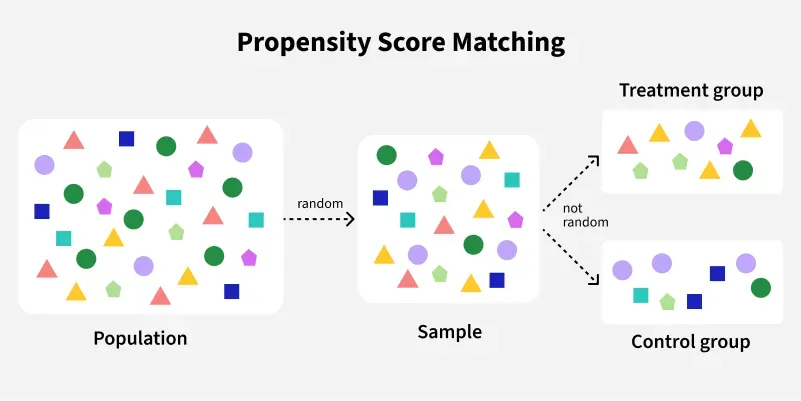
Propensity Score Matching is a statistical technique used to reduce selection bias by matching individuals from different groups based on similar characteristics. It attempts to simulate the conditions of a randomized experiment.
A propensity score is the probability that an individual receives the treatment given a set of observed covariates.
Mathematically, the propensity score is defined as:
Where:
indicates that the individual is in the treatment group.
is the vector of observed covariates.
is the propensity score.
Uses of Propensity Score Matching
Problem with Observational Data
In randomized experiments, treatment is assigned randomly.
In observational data, treatment is not random—people may self-select based on age, income, education, etc.
This causes confounding, which biases the treatment effect.
Solution: Match Based on Propensity Scores
Rather than matching individuals exactly on every covariate (which can be impossible with many variables), match them based on the propensity score—a single number summarizing covariate information.
Steps in Propensity Score Matching
1. Model the Propensity Score
Use logistic regression (or another classification model) to estimate each individual’s probability of receiving the treatment.
2. Match Individuals
Match treated and untreated individuals based on similar propensity scores. Several matching methods are used (explained below).
3. Check Balance
Evaluate whether the matched groups have similar covariate distributions.
4. Estimate Treatment Effect
After matching, estimate the average treatment effect by comparing outcomes between the groups.
Propensity Score Estimation
The most common method for estimating propensity scores is logistic regression.
Where:
𝑋𝑖 are covariates (e.g., age, income).
𝛽𝑖 are coefficients estimated from the data.
Types of Matching Methods
Nearest Neighbor Matching- Match each treated individual with an untreated individual with the closest propensity score.
Caliper Matching- Matches are made only if the propensity score difference is within a certain threshold (e.g., 0.01).
Radius Matching- Similar to caliper but allows multiple matches within a radius.
Kernel Matching- Uses a weighted average of untreated individuals with weights decreasing with distance in propensity score.
Stratification Matching- Divide the range of propensity scores into intervals (strata) and compare outcomes within each.
Propensity Score Matching
Here’s how to perform simple PSM using Python.
Output
Estimated Treatment Effect: 2.04
Assessing Matching Quality
1. Standardized Mean Difference (SMD)
SMD compares means between groups. A value < 0.1 after matching indicates good balance.
2. Covariate Balance Plots
Visualize distributions before and after matching to assess improvement.
Applications of PSM
Healthcare: Compare patients receiving different treatments.
Economics: Evaluate impact of training programs on income.
Education: Assess effectiveness of new curricula.
Social Sciences: Study effects of policies like minimum wage laws.
Advantages of PSM
Reduces selection bias due to observable covariates.
Does not require exact matching on all variables.
Easy to interpret and implement.
Limitations of PSM
Unobserved Confounding: PSM does not address bias from variables not included in the model.
Sample Size Loss: Matching can discard unmatched units.
Model Dependence: Results depend on the logistic model and variable selection.
