 |
VOOZH | about |
|
VOOZH | about |
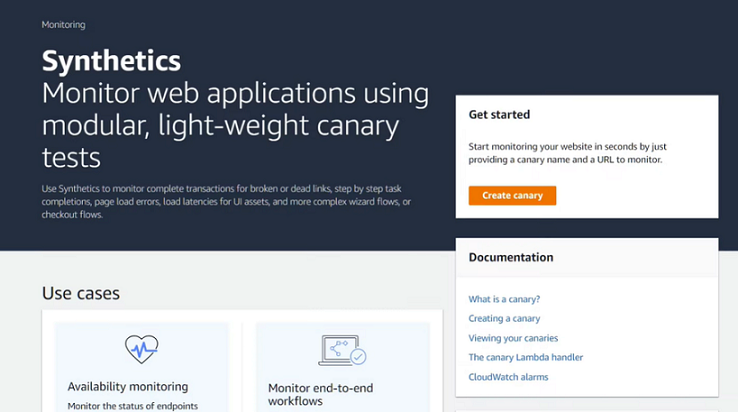
Amazon CloudWatch Synthetics helps you create different types of canaries to continuously monitor and test your applications and user experience, even when there is no real user traffic. It helps detect unusual behaviour, identify performance issues and trace problems to their source for faster troubleshooting and resolution.
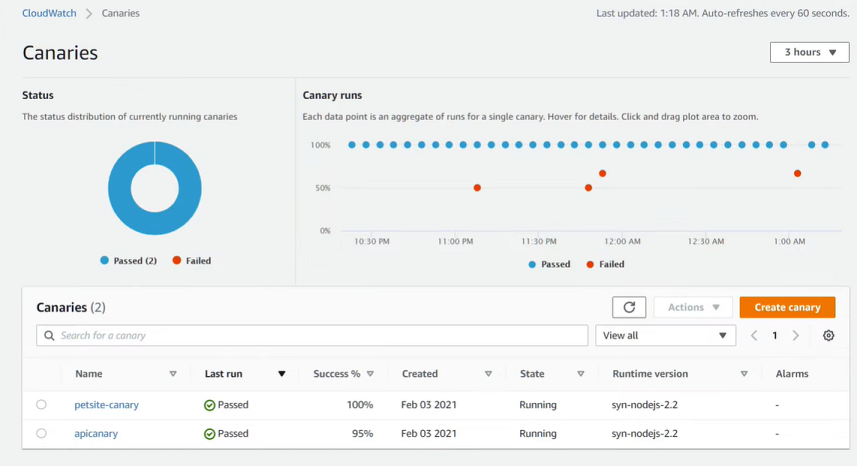
Step 1: Navigate to CloudWatch Synthetics from the AWS Management Console.
Amazon CloudWatch Synthetics allows you to create configurable scripts called canaries to continuously monitor application endpoints and APIs. These canaries help detect website issues and performance problems before they impact customers.
Here we already have two canaries monitoring our sample pet adoption site.
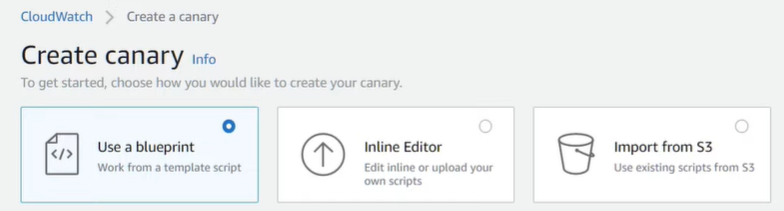
Step 2: Let's create a third canary. Canaries can be created using pre-built blueprints, editable inline scripts, a workflow builder, or a canary recorder.
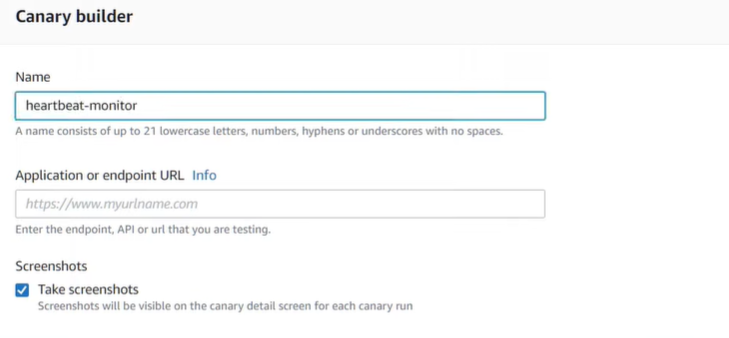
Step 3: For this canary, select the Heartbeat monitoring blueprint. This blueprint loads the specified URL and stores screenshots, HTTP archive files, and logs of accessed URLs. In this example, enter the URL of the sample pet adoption website.
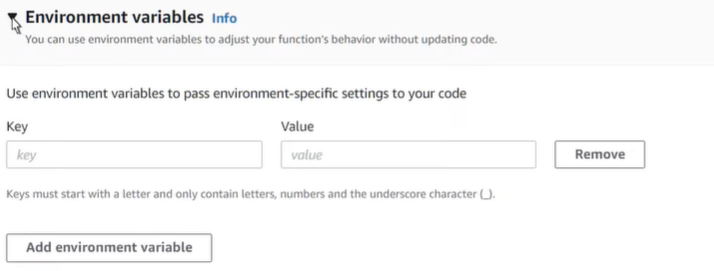
Step 4: Let's move on without inputting any environment variables.
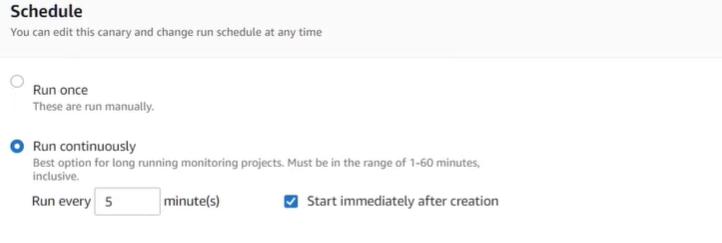
Step 5: We'll also retain the default settings for scheduling.
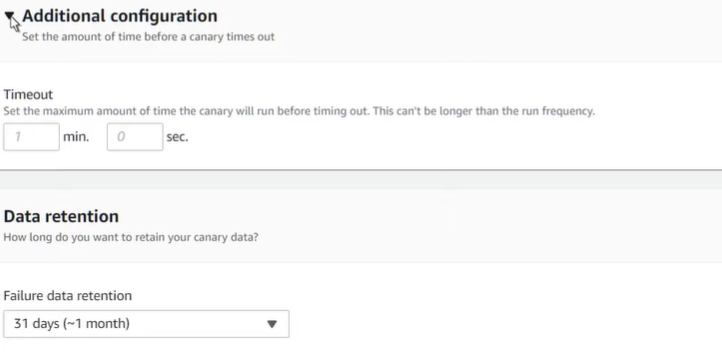
Step 6: We'll also keep the default timeout settings. If you have specific data retention policies you can change the default settings here to maintain compliance.
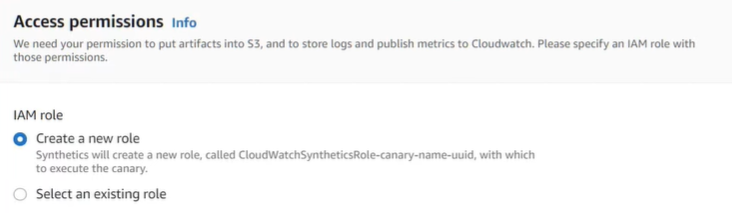
Step 7: Under Access permissions, choose whether to create a new IAM role for the canary or use an existing role. In this example, select Create a new role.
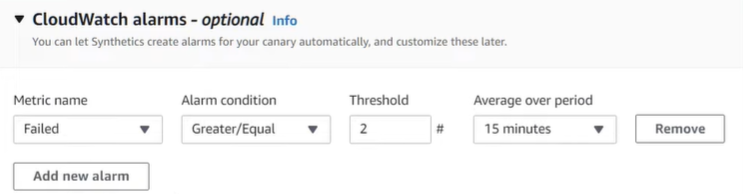
Step 8 (optional) : You can configure CloudWatch Synthetics to automatically create CloudWatch alarms for your canary. In this example, create an alarm that sends an Amazon SNS notification if the canary fails two or more times within 15 minutes.
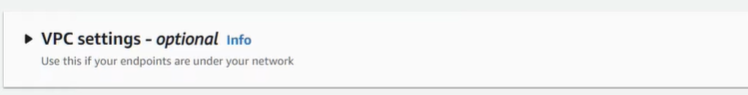
Step 9: If your application endpoint is inside a Virtual Private Cloud (VPC), you can select the required VPC settings in this section.
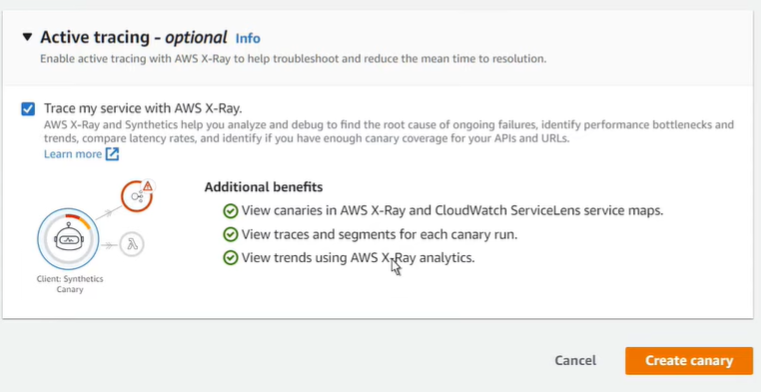
CloudWatch Synthetics can be integrated with AWS X-Ray and CloudWatch ServiceLens Service Maps for enhanced monitoring and tracing. Enable the integration settings and click on Create canary to create the canary.
Step 10: Our heartbeat monitoring canary has been successfully created.
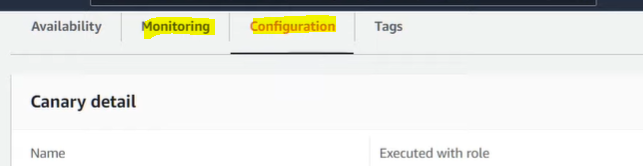
Canaries with tracing enabled also appear on the Service Map in both CloudWatch ServiceLens and AWS X-Ray. You can open the Monitoring tab to view CloudWatch metric graphs for the selected time range. The Configuration tab displays the current canary settings and details such as the last modified time.