AWS Cost Explorer helps you visualize, analyze, and manage AWS costs and usage over time using default and custom reports. It enables teams to identify waste, understand spending trends, and forecast future cloud costs effectively.
Visualizes AWS cost and usage data across services and time periods.
Provides default and customizable reports for detailed cost analysis.
Helps identify unused or underutilized resources to reduce waste.
Supports cost forecasting and better financial planning.
Core Features
Visualize Costs: View data for up to the last 13 months.
Forecast: Predict future AWS spending for the next 12 months based on past usage.
Granular Filtering: Filter costs by Service, region, Instance Type, Tags, and more for detailed analysis.
RI/SP Recommendations: Get recommendations for Reserved Instances and Savings Plans to reduce overall cloud costs.
Cost Explorer vs. AWS Budgets
A common point of confusion is the difference between these two tools.
Feature
AWS Cost Explorer
AWS Budgets
Purpose
Analysis & Discovery. "Where did my money go last month?"
Monitoring & Alerting. "Stop me if I spend more than $100."
Timeframe
Historical (Last 13 months) + Forecast.
Future-looking (Current month/quarter).
Action
Provides insights and recommendations.
Sends alerts (SNS/Email) when thresholds are breached.
Granularity
Deep dive into daily/hourly usage.
High-level tracking against a fixed number.
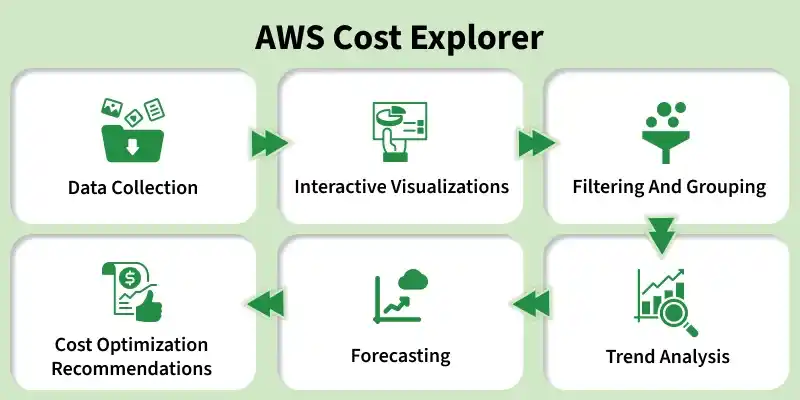
Working of AWS Cost Explorer
AWS Cost Explorer is a tool that helps you visualize and manage your AWS costs. Here's a brief overview of how it operates:
Forecasting: Predicts future AWS expenses using historical spending data.
Cost Optimization Recommendations: Suggests ways to reduce costs, including Savings Plans and Reserved Instances recommendations.
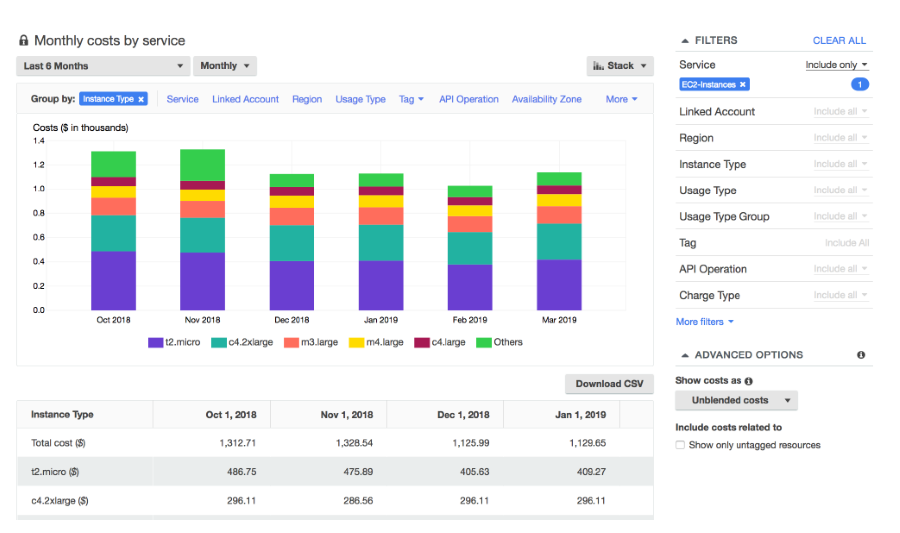
Mastering Filters and Grouping
The real strength of AWS Cost Explorer comes from its filtering and grouping features, which help users analyze cloud costs in detail.
1. Group By
Grouping helps break down total AWS costs into categories.
Group by Service: View spending across services like EC2, RDS, and S3.
Group by Region: Shows costs by geographic location (e.g., US-East-1 vs. EU-West-1).
Group by Usage Type: Get the most detailed view of charges like BoxUsage:t3.micro or DataTransfer-Out-Bytes.
2. Filtering
Filtering allows you to isolate specific datasets.
Tag Filters: If you tag your resources (e.g., Project: BetaApp), you can filter to see only the costs for that project.
Service Filters: Focus on costs of a single service, such as EC2, to investigate spending spikes.
Note: To find "Phantom Costs" (costs from resources you thought you deleted), Group by Region and Filter by Service. You might find an idle DynamoDB table in a region you never use!
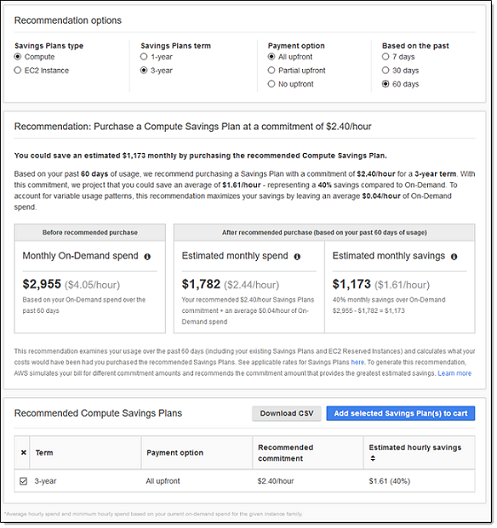
AWS Savings Plan
AWS Savings Plans help reduce cloud costs by offering discounted pricing in exchange for a consistent usage commitment over a 1-year or 3-year period.
They are one of the easiest and most effective ways to optimize AWS spending.
AWS recommends starting with Savings Plans before moving to advanced cost optimization techniques because they provide significant savings with simple management.
Navigate to the AWS Cost Explorer dashboard to view an overview of your current month’s estimated costs, daily spending graphs, monthly cost forecasts, top cost trends, and recently viewed reports.
AWS Cost Explorer provides a clear overview of your monthly AWS spending and usage patterns.
Month-to-Date Costs: Track your current month’s spending and compare it with your planned budget or previous month’s costs.
Forecasted End-of-Month Costs: View estimated total monthly expenses based on current usage trends for better budgeting.
Daily and Monthly Unblended Costs: Analyze spending through detailed graphs showing daily and monthly expenses without blended pricing adjustments. You can also customize reports using filters and the Explore Costs option.
2. Analyzing Cost Trends
AWS Cost Explorer helps users understand spending patterns and identify major cost contributors.
Top Cost Drivers: The “This Month’s Trends” section highlights the services or resources generating the highest AWS costs.
Detailed Trend Reports: Users can open detailed reports for specific trends to analyze cost increases, usage spikes, and spending fluctuations in depth.
3. Evaluating Reserved Instance Costs
AWS Cost Explorer helps users analyze the effectiveness and savings of Reserved Instances (RIs).
Amortized Costs Analysis: Understand how RI upfront and recurring costs are distributed over time to measure actual savings.
Usage Efficiency: Review RI utilization reports to identify underused Reserved Instances and improve cost optimization.
4. Customizing Your Cost Exploration
AWS Cost Explorer offers flexibility to tailor your cost analysis
Filtering and Grouping: Apply filters based on services, accounts, regions or tags to focus on specific areas of interest. Group your costs by different dimensions to gain insights aligned with your organizational structure.
Adjustable Time Frames: Select custom date ranges to analyze costs over specific periods. Whether you are looking at daily fluctuations or monthly trends, this feature allows for both granular and high-level analysis.
5. Leveraging Insights for Cost Optimization
By analyzing AWS Cost Explorer data, users can improve cost management and resource efficiency.
Identify Savings Opportunities: Detect idle resources, over-provisioned services or areas where you can benefit from cost-saving programs like Savings Plans or Spot Instances.
Improve Budgeting Accuracy: Use historical data and forecasts to create more precise budgets and financial forecasts enhancing your organization's financial planning.
Enhance Operational Efficiency: Make informed decisions about resource allocation and usage patterns aligning your AWS expenditures with business objectives.
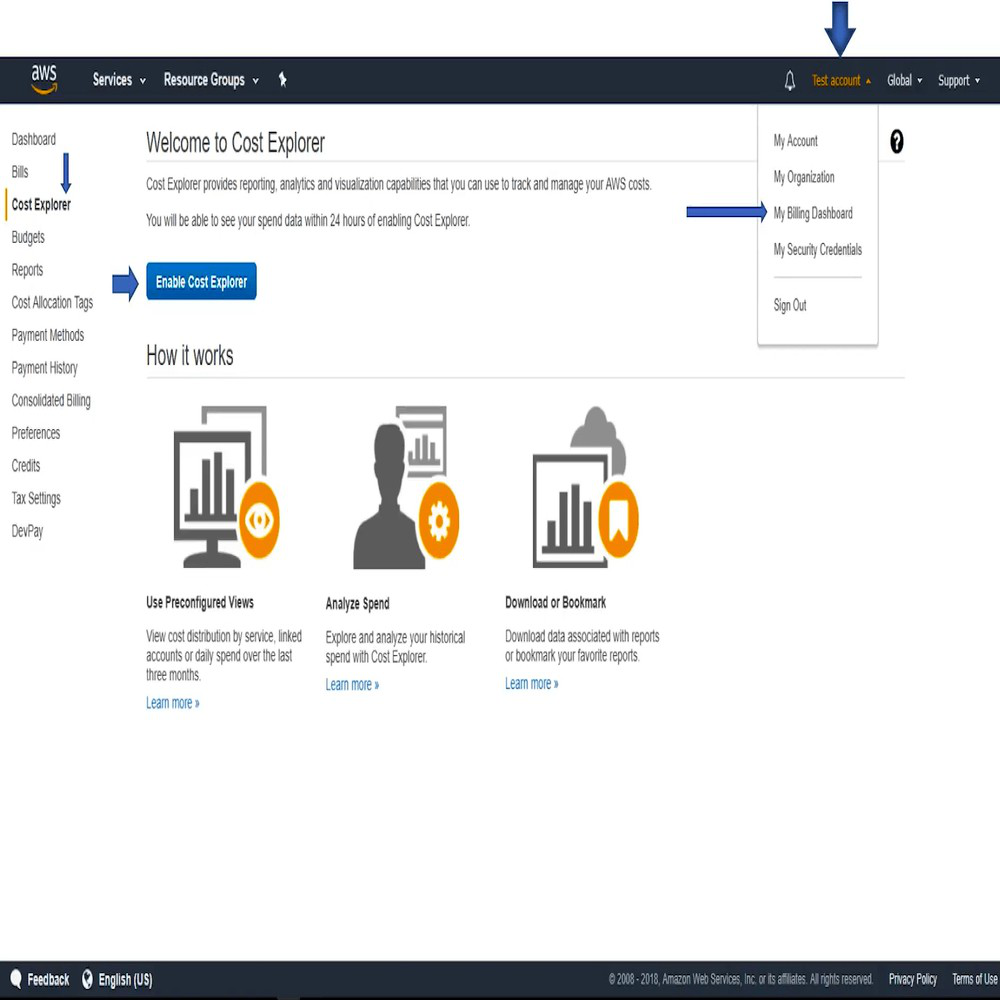
Getting Started with AWS Cost Explorer
1. You can start using Cost Explorer by opening the Billing and Cost Management console and choosing Launch Cost Explorer. Hereby Sign in to the AWS Management Console and open the Billing and Cost Management console. In the navigation pane, choose Cost Explorer.
3. It displays Cost and usage Information in bar format about the Cost for used Service and the number of hours the service was used. Here some of the tools helpful for estimating, tracking, and Monitoring against costs plans in the AWS cloud
Category
Tool/Feature
Estimating Costs
TCO (Total Cost of Ownership) Calculator
Pricing Calculator
Tracking Costs
Billing Dashboard
Cost Allocation Tags
Cost and Usage Reports
AWS Cost Explorer
Monitoring Against Cost Plans
Billing Alarms
AWS Budgets
Advanced Features
1. Forecasting
Cost Explorer uses machine learning on your historical data to predict future spend.
Use Case: Helps estimate if your current spending trend may exceed future budgets.
Confidence Interval: Displays an estimated spending range with around 80% confidence for better financial planning.
2. Savings Plans & RI Reports
Cost Explorer analyzes your past usage to recommend commitment-based discounts.
Coverage Report: Shows what percentage of your usage is covered by RIs/Savings Plans.
Utilization Report: Displays how effectively purchased RIs are being used and helps identify wasted reservations
Real-World Use Cases
Monitoring monthly cloud expenses
Tracking project-wise spending using tags
Detecting unexpected cost spikes
Planning long-term cloud budgets
Best Practices
Enable Cost Allocation Tags: Tag all AWS resources with labels such as Environment, CostCenter, and Owner for accurate cost tracking and management.
Check Anomaly Detection Daily: Set up SNS alerts so you get an email the moment a spike occurs.
Review "Unblended" Costs: In AWS Organizations, use unblended costs to understand the actual spending of individual accounts clearly.
