 |
VOOZH | about |
|
VOOZH | about |
Grafana is an open-source monitoring tool that enables users to create custom dashboards and visualizations.
The following installation should be done before moving to the next section :
Step 1: Create Kubernetes Cluster
The first step is to create a Kubernetes cluster . kind is recommended for creating a Kubernetes cluster because it supports multiple nodes on local machine. Start docker and use the configuration file provided below to create the cluster.
1. Configure YAML
config.yaml
kind: Cluster
apiVersion: kind.x-k8s.io/v1alpha4
nodes:
- role: control-plane
 extraPortMappings:
 - containerPort: 32215
 hostPort: 80
- role: worker
- role: worker
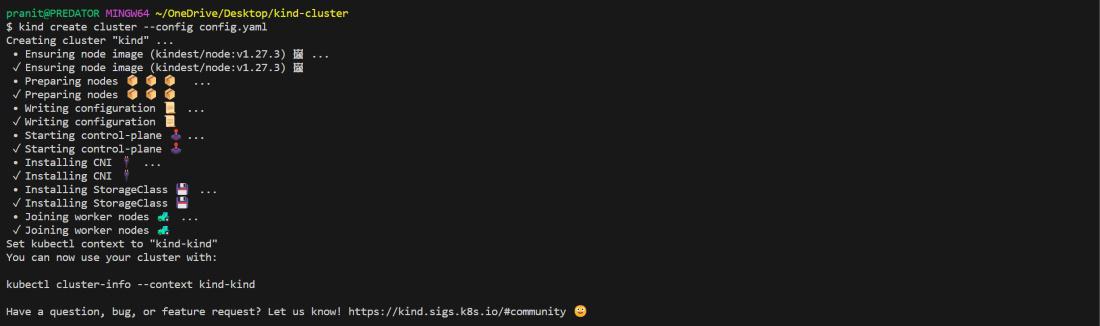
Create the kubernetes cluster using the below command .
kind create cluster --config config.yaml
👁 Create the kubernetes cluster
2 Deploy and autoscale an application on the Kubernetes cluster
After creating the cluster follow the below yaml files to deploy and autoscale an application on the Kubernetes cluster.
deployment.yaml
apiVersion: apps/v1
kind: Deployment
metadata:
 name: drupal
 labels:
 app: drupal
spec:
 replicas: 1
 selector:
 matchLabels:
 app: drupal
 template:
 metadata:
 labels:
 app: drupal
 spec:
 containers:
 - name: drupal
 image: drupal:latest
 ports:
 - containerPort: 80
 resources:
 limits:
 cpu: 500m
 requests:
 cpu: 200m
kubectl apply -f deployment.yaml👁 Deploy and Autoscale application
3) Download the metrics server
Download the metrics server yaml file
https://release-assets.githubusercontent.com/github-production-release-asset/92132038/0626adef-e098-4155-ab3f-6f67afd3bce4?sp=r&sv=2018-11-09&sr=b&spr=https&se=2025-07-23T11%3A55%3A09Z&rscd=attachment%3B+filename%3Dcomponents.yaml&rsct=application%2Foctet-stream&skoid=96c2d410-5711-43a1-aedd-ab1947aa7ab0&sktid=398a6654-997b-47e9-b12b-9515b896b4de&skt=2025-07-23T10%3A54%3A39Z&ske=2025-07-23T11%3A55%3A09Z&sks=b&skv=2018-11-09&sig=vnLH3B1kucdbPWlevDXaK76xuUJKS7G7J1Y6%2Fk5ddZA%3D&jwt=eyJhbGciOiJIUzI1NiIsInR5cCI6IkpXVCJ9.eyJpc3MiOiJnaXRodWIuY29tIiwiYXVkIjoicmVsZWFzZS1hc3NldHMuZ2l0aHVidXNlcmNvbnRlbnQuY29tIiwia2V5Ijoia2V5MSIsImV4cCI6MTc1MzI2OTUxOSwibmJmIjoxNzUzMjY5MjE5LCJwYXRoIjoicmVsZWFzZWFzc2V0cHJvZHVjdGlvbi5ibG9iLmNvcmUud2luZG93cy5uZXQifQ.AUImUOb_ajLcs2WiB2gDAtr-F13Zs38fgMsIlWFA9tM&response-content-disposition=attachment%3B%20filename%3Dcomponents.yaml&response-content-type=application%2Foctet-stream
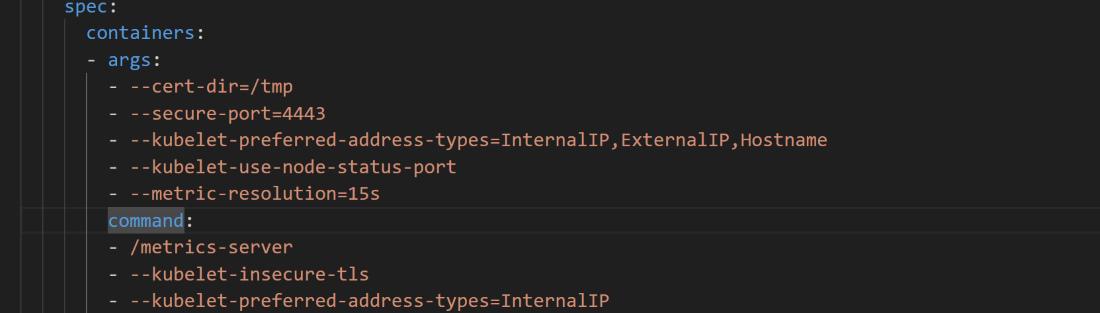
Then after downloading the components.yaml , under the section container add this command part (line number 140 in components.yaml):
 command:
 - /metrics-server
 - --kubelet-insecure-tls
 - --kubelet-preferred-address-types=InternalIP
👁 Add command in components.yaml
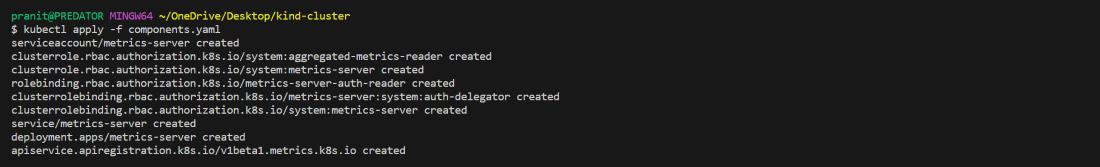
Create the metric server using the command below
kubectl apply -f components.yaml
4) Create a service to connect the deployment
service.yaml
apiVersion: v1
kind: Service
metadata:
 name: my-service
spec:
 type: NodePort
 selector:
 app: drupal
 ports:
 - port: 80
 targetPort: 80
 nodePort: 32215
Create a service to connect the deployment from the localhost.
kubectl apply -f service.yaml
👁 Create a service to connect the deployment
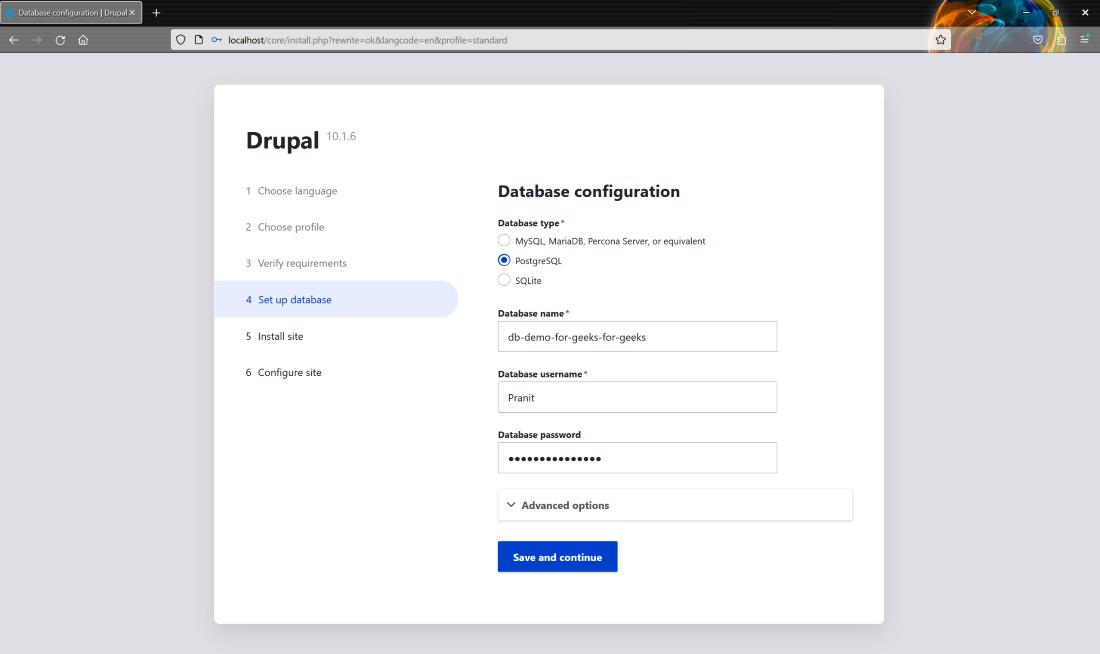
After service is created you can access the website at http://localhost:80/ .
👁 Access the website
5) Create a horizontal pod autoscaler
hpa.yaml
apiVersion: autoscaling/v1
kind: HorizontalPodAutoscaler
metadata:
 name: drupal
spec:
 scaleTargetRef:
 apiVersion: apps/v1
 kind: Deployment
 name: drupal
 minReplicas: 1
 maxReplicas: 10
 targetCPUUtilizationPercentage: 50
Create a horizontal pod autoscaler (this will scale up or scale down the number of pods on the user traffic)
kubectl apply -f hpa.yaml
👁 Create a horizontal pod autoscaler
Step 2: Setup Prometheus and Grafana on the cluster
The second step is to setup Prometheus and Grafana on the cluster .
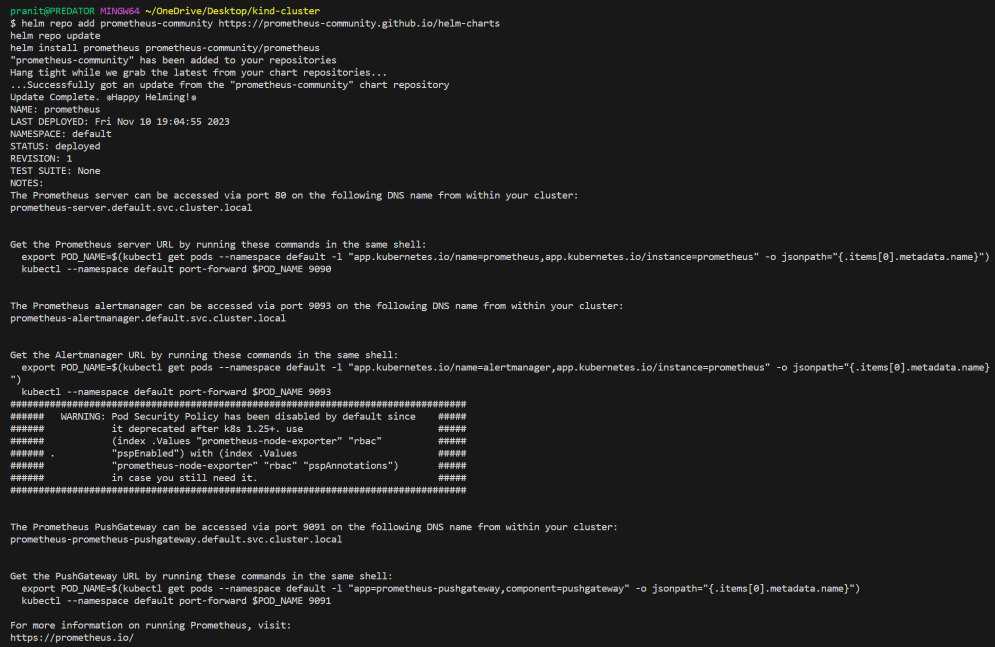
The following commands will setup Prometheus server on the cluster.
helm repo add prometheus-community https://prometheus-community.github.io/helm-charts/
helm repo update
helm install prometheus prometheus-community/prometheus
👁 Setup Prometheus server on the cluster
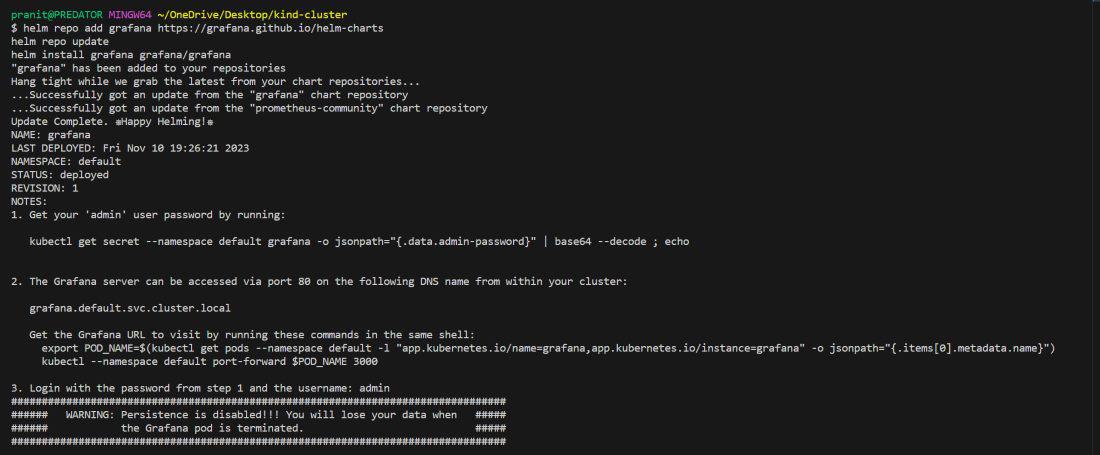
The following commands will setup Grafana server on the cluster.
helm repo add grafana https://grafana.github.io/helm-charts/
helm repo update
helm install grafana grafana/grafana
👁 Setup Grafana server on the cluster
After installing Grafana, a command will be available in the terminal to obtain the Grafana server password.
kubectl get secret --namespace default grafana -o jsonpath="{.data.admin-password}" | base64 --decode ; echo👁 Obtain Grafana server password
Step 3: Connect the Prometheus server and Grafana server
The third step is to connect the Prometheus server and Grafana server . Use different terminals to write the below commands .Start the Prometheus server at port 9090 in localhost.
kubectl port-forward service/prometheus-server 9090:80👁 Connect the Prometheus server and Grafana server
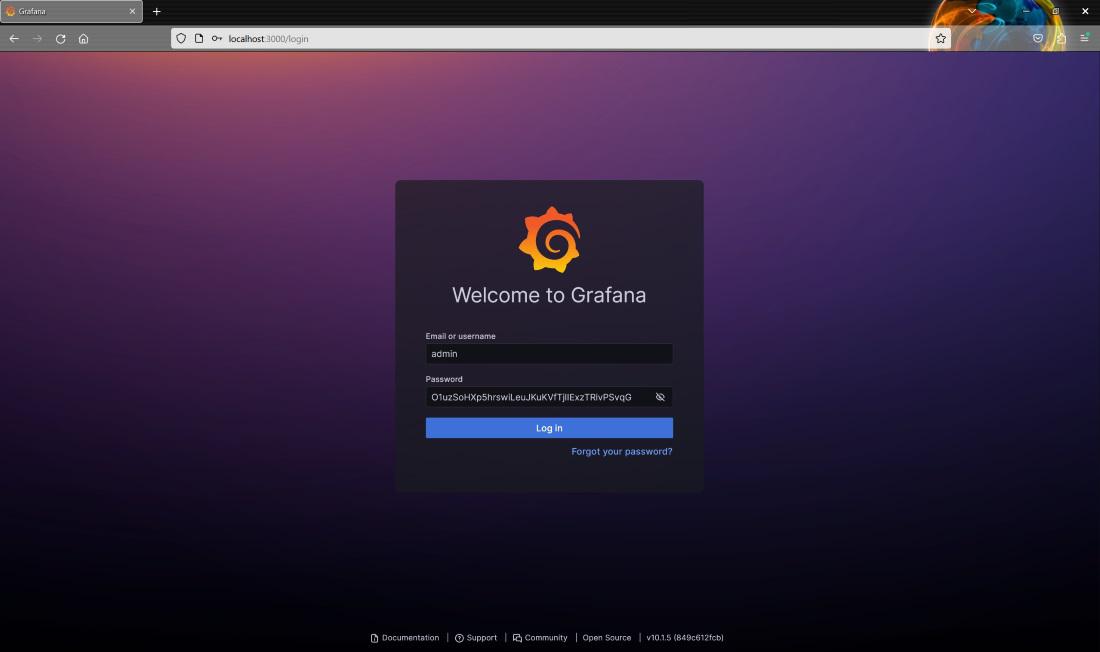
Start the Grafana server at port 3000 in localhost.(to login into your Grafana you will require the password obtained in step 2)
kubectl port-forward service/grafana 3000:80👁 Start the Grafana server at port 3000 in localhost
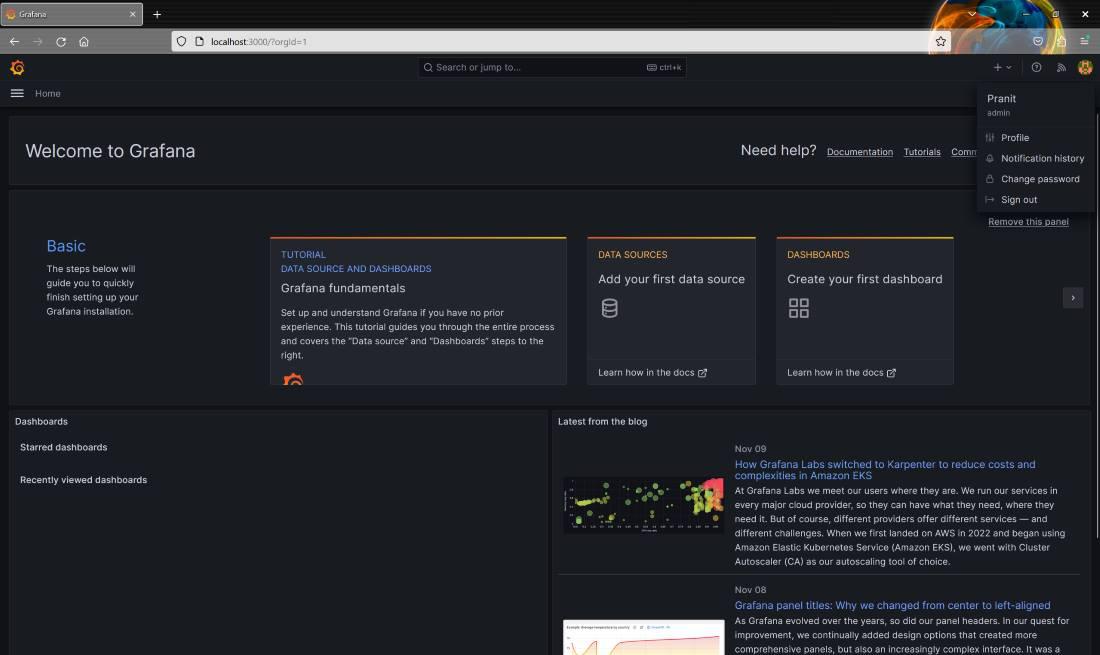
Access the Grafana server at http://localhost:3000
Step 4: Integrate the Prometheus server and Grafana server
The fourth step is to integrate the Prometheus server and Grafana server. Begin by logging into the Grafana server. You can then edit your username . Then, create a new data source, Prometheus.
👁 logging into the Grafana server
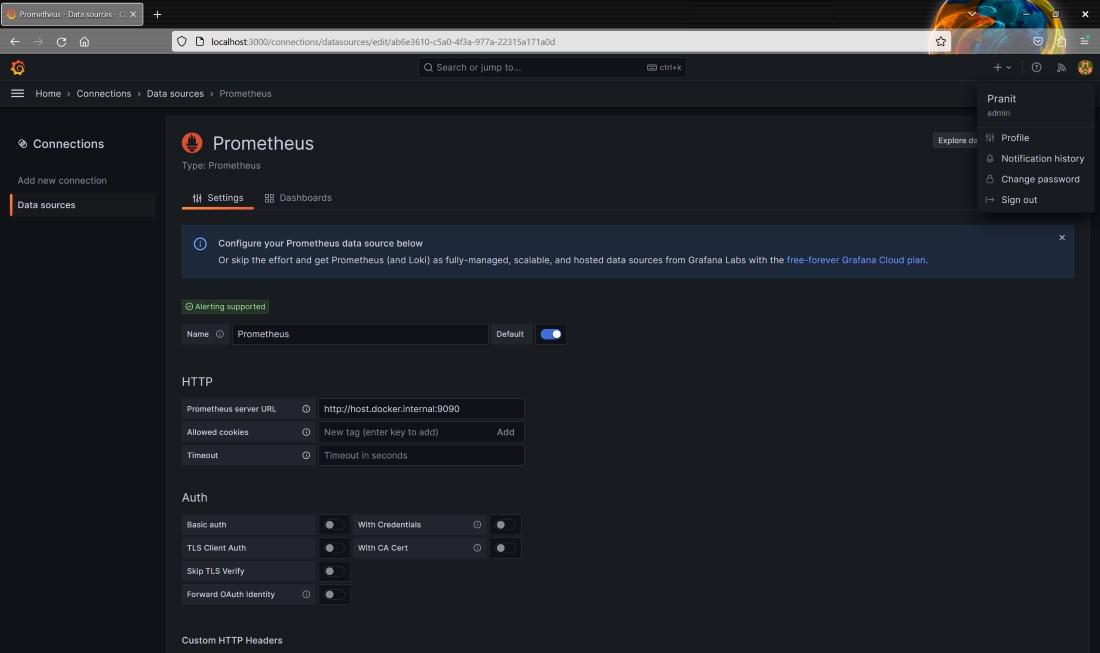
Since both Prometheus and Grafana are running on Docker, use http://host.docker.internal:9090 instead of http://localhost:9090 for the connection. You can save and test connection .
👁 Configure your prometheus data source
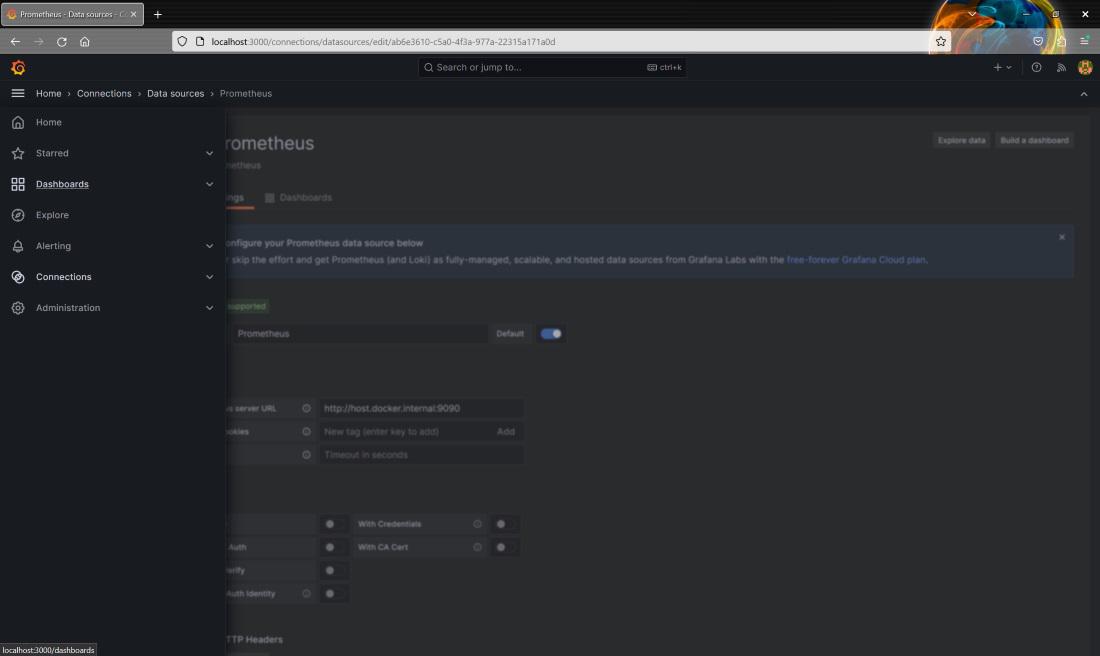
Step 5: Observe the Kubernetes cluster.The fifth step is to observe the Kubernetes cluster using Grafana dashboards . Navigate to the left section, choose the "Dashboard" option,
👁 Choose the "Dashboard" option
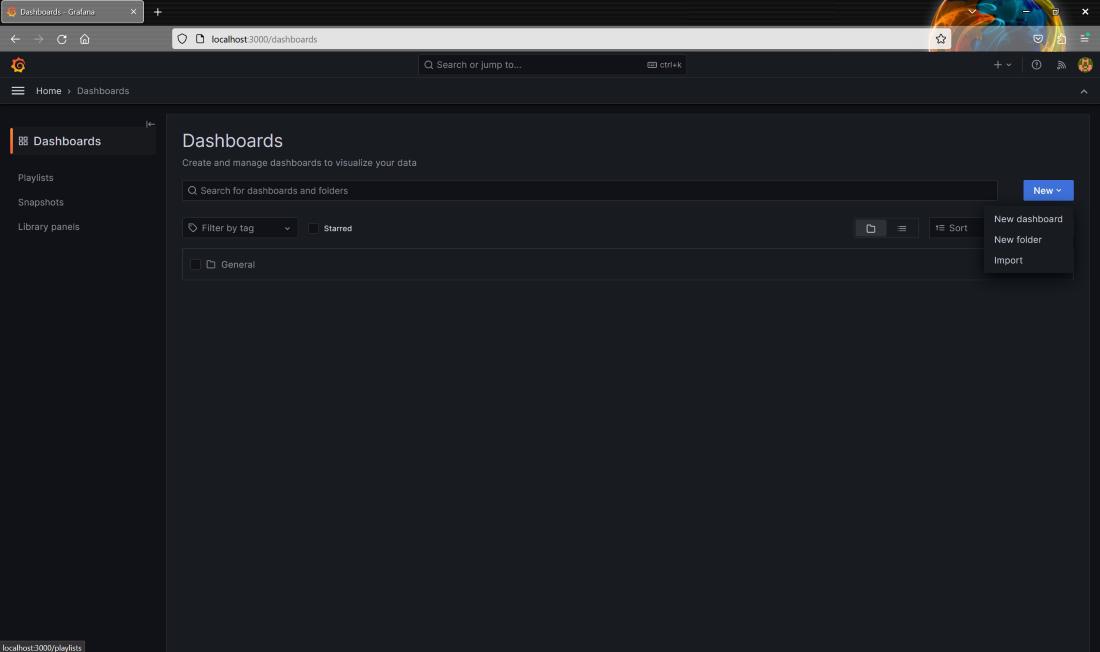
then select "New" and then select "Import".
👁 Select "New" and then select "Import"
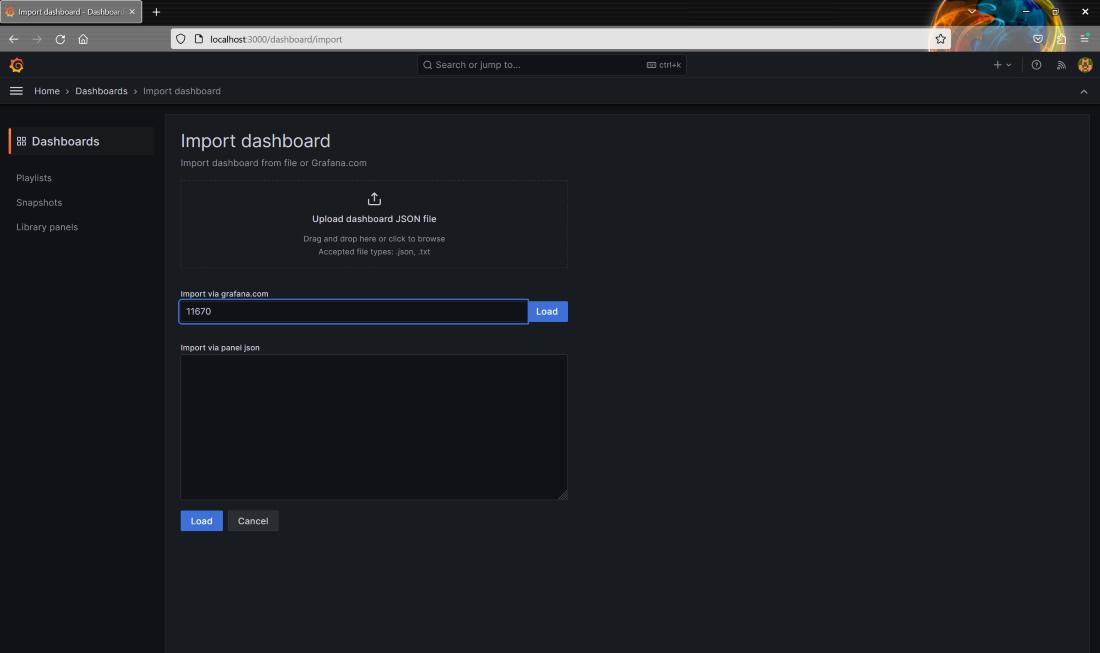
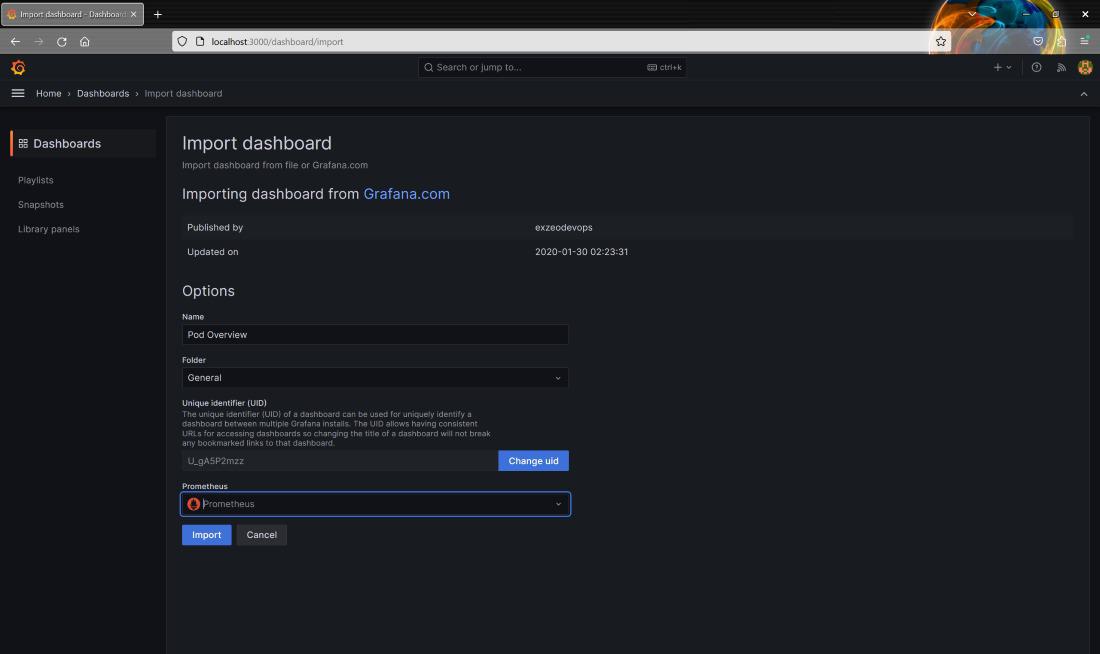
Now here, input IDs in the grafana.com and then press load .
👁 Import Dashboard
Then attach Prometheus data source to observe some default Grafana dashboard the cluster.
👁 Attach Prometheus data source
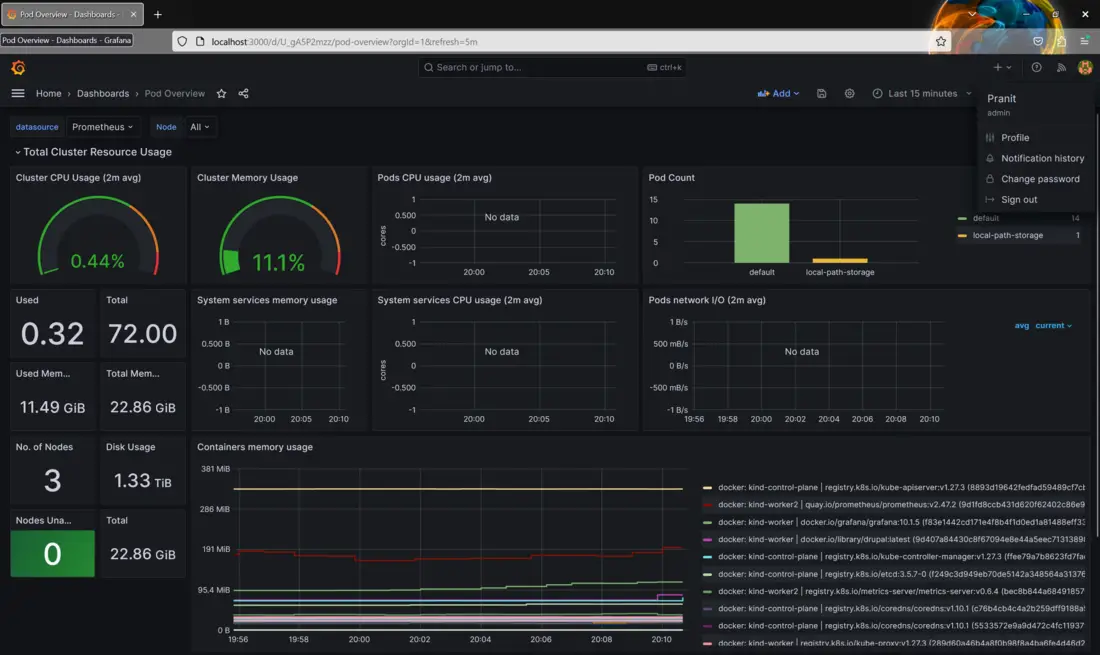
You can apply more load on the pods and observe the changes in Grafana . To apply more load on the Kubernetes cluster use this command : kubectl run -i --tty load-generator --image=busybox -- sh -c "while true; do wget -O - http://my-service:80; done"
Here you can observe the number of pods running in the default namespace and also find out the number of nodes running in the cluster.
👁 Dashboard ID for pod overview
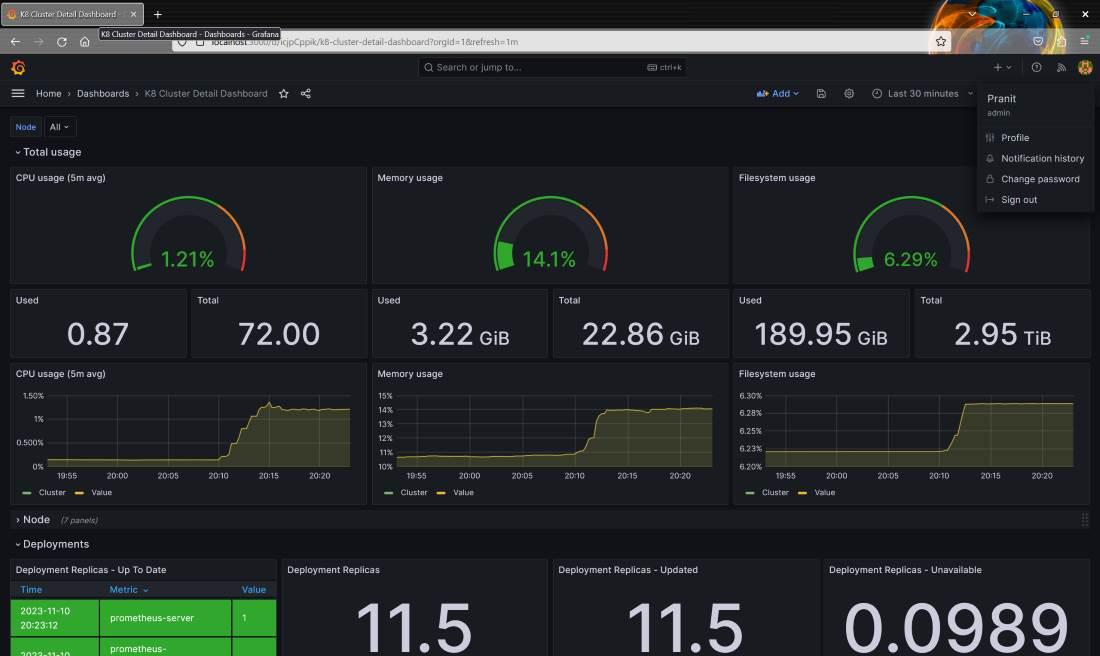
👁 Dashboard ID for Kubernetes cluster details : 10856
To monitor the Kubernetes cluster you can use this id : 6417 . To observe more pod details use this dashboard id : 15760