 |
VOOZH | about |
|
VOOZH | about |
In monitoring has always been an essential layer of any powerful cloud-native architecture, and Kubernetes is not an exception. One of the most frequently used and mentioned open-source monitoring tools is Prometheus which is usually used in conjunction with Grafana for metrics visualization. of all exporters that are used with Prometheus, the Node Exporter is a must-have in your tool belt to collect hardware and OS-level metrics from your node. It will expose the steps for installing the Prometheus Node Exporter in the Kubernetes environment.
The Prometheus Exporter is a small application that can take monitoring metrics from the target system and display those metrics via a web URL that allows the Prometheus server to scrape those metrics.
In the node exporter exports hardware and OS metrics to the *NIX kernel. By default, Kubernetes does not publish monitoring metrics at the node level. To back up, to track metrics for a Kubernetes node, we need the Prometheus node exporter running on all nodes. It can collect all system monitoring metrics and display them using the /metrics web path on port 9100. It must be used as a daemon set in order for Kubernetes to run on every cluster node.
1. Connect to a GKE cluster.
gcloud container clusters get-credentials demo-k8s-cluster2. Copy the following information to the file node-exporter. yaml. Here we are using a monitoring namespace that was already created when the Prometheus Server was deployed.
apiVersion: apps/v1
kind: DaemonSet
metadata:
 labels:
 app: node-exporter
 name: node-exporter
 namespace: monitoring
spec:
 selector:
 matchLabels:
 app: node-exporter
 template:
 metadata:
 labels:
 app: node-exporter
 spec:
 containers:
 - args:
 - --path.sysfs=/host/sys
 - --path.rootfs=/host/root
 - --no-collector.wifi
 - --no-collector.hwmon
 - --collector.filesystem.ignored-mount-points=^/(dev|proc|sys|var/lib/docker/.+|var/lib/kubelet/pods/.+)($|/)
 - --collector.netclass.ignored-devices=^(veth.*)$
 name: node-exporter
 image: prom/node-exporter
 ports:
 - containerPort: 9100
 protocol: TCP
 resources:
 limits:
 cpu: 250m
 memory: 180Mi
 requests:
 cpu: 102m
 memory: 180Mi
 volumeMounts:
 - mountPath: /host/sys
 mountPropagation: HostToContainer
 name: sys
 readOnly: true
 - mountPath: /host/root
 mountPropagation: HostToContainer
 name: root
 readOnly: true
 volumes:
 - hostPath:
 path: /sys
 name: sys
 - hostPath:
 path: /
 name: root
3. Deploy the daemonset using a “kubctl apply” command.
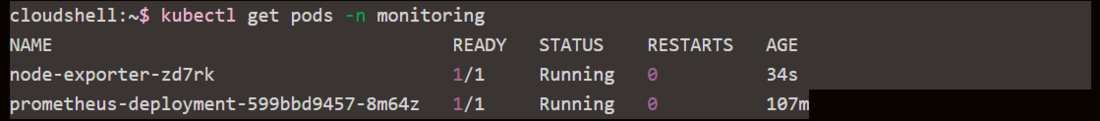
kubectl apply -f node-exporter.yaml4. List a daemonsets that make up search namespace and verify that their status is Running. Everyone should have a daemon configured for each node. In this demo we have only one node so only one daemonset is running.
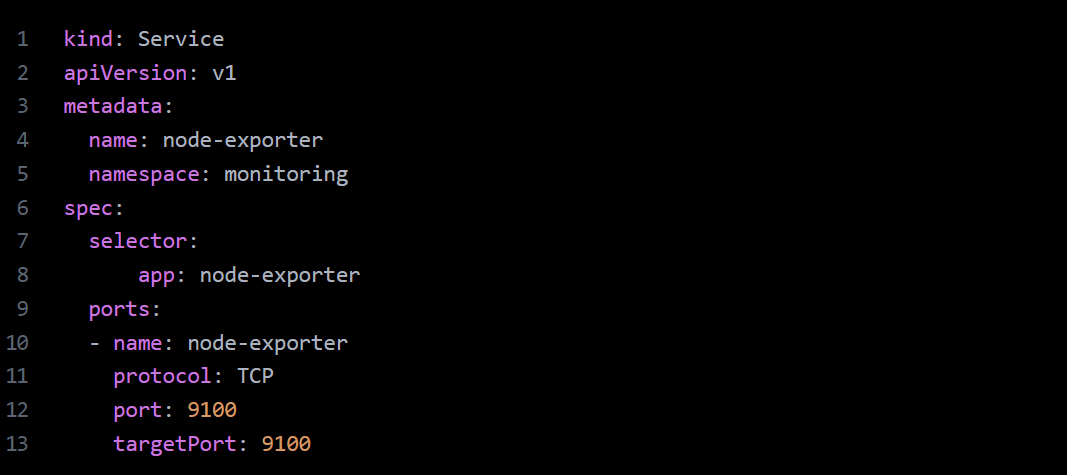
5. Now we are going to use Kubernetes service for the node-exporter daemon sets. Copy following yaml entries to the file node-exporter-service.yaml.
6. Create node-exporter service with below command.
kubectl create -f node-exporter-service.yml7. List a services for the node-exporter service.
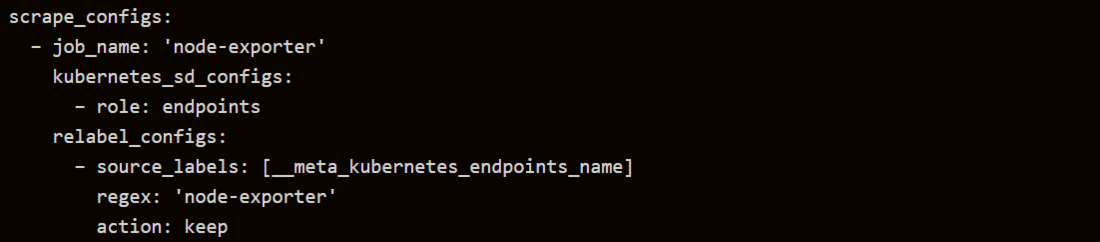
8. Now we need to ensure that the node exporter scrape settings are added to Prometheus server config file. We have already added this when running the Prometheus server in a previous post. Add the following settings under the scrape_configs sections, if they are not already added.
9. Connect to a Prometheus console using the kubectl port-forwarding, see below.
from a browser you can be access Prometheus console by using url: http://localhost:8080
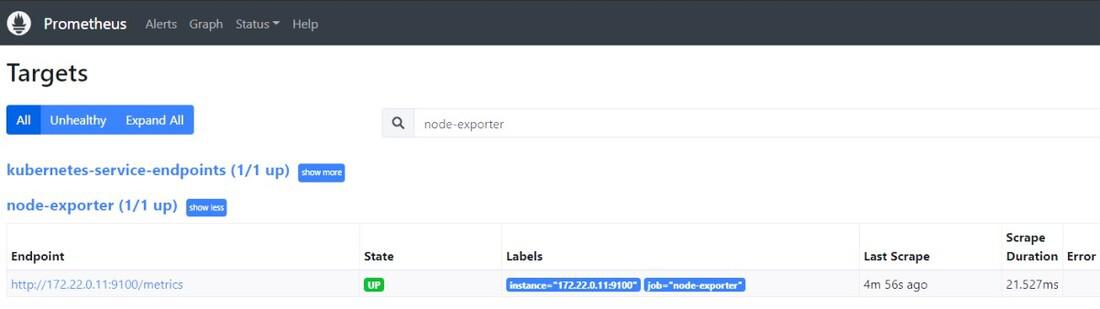
1.See targets section screen shot below for node-exporter target.
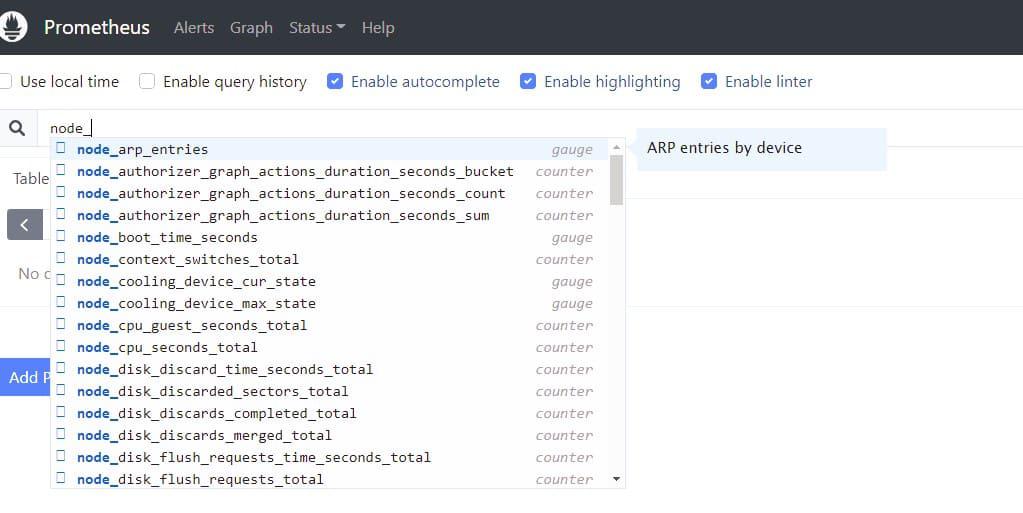
2. You can be query node exporter metrics from the Prometheus search console using the “node_” prefix.
In these steps, you have been successfully deployed Prometheus Node Exporter to your Kubernetes cluster. This is configuration allows to Prometheus to scrape valuable node-level metrics, which can be made visible in Grafana or managed directly in Prometheus. This is important step in how to build robust observability stack for your Kubernetes environment.