 |
VOOZH | about |
|
VOOZH | about |
Prometheus is considered an open-source monitoring system that is popular for event monitoring and alerting. Over time, the components and features of the ecosystem change as new ones are added to increase the system’s capabilities. One of such features is the Prometheus Agent, which allows organizations to keep track of what is going on in their environment. This article aims to give detailed explanations regarding Prometheus Agent: the foundational concepts, relevant terminologies, installation process, and configuration rules, as well as real-world scenarios.
Prometheus Agent is a relatively recent component of Prometheus, existing from the second version of Prometheus. 30. 0. In contrast to a full Prometheus server, the agent is used for scrapping and the remote writing of metrics as well as for simplistic data visualization, but it lacks some built-in functionalities such as local relational database or rule engine. In such cases, when resources are scarce or if the tasks require aggregation across instances and the results are to be stored in a Prometheus server, this is the best solution to use.
For Linux/macOS: Download the latest release
wget https://release-assets.githubusercontent.com/github-production-release-asset/6838921/6538e824-92d8-46f9-830c-7d81a91ff6fe?sp=r&sv=2018-11-09&sr=b&spr=https&se=2025-07-23T13%3A05%3A03Z&rscd=attachment%3B+filename%3Dprometheus-2.30.0.linux-amd64.tar.gz&rsct=application%2Foctet-stream&skoid=96c2d410-5711-43a1-aedd-ab1947aa7ab0&sktid=398a6654-997b-47e9-b12b-9515b896b4de&skt=2025-07-23T12%3A04%3A22Z&ske=2025-07-23T13%3A05%3A03Z&sks=b&skv=2018-11-09&sig=SXLUN%2Fx4qqDB5jaTSQymmPw40KZ1VD%2B8xMkR7E0l5Bs%3D&jwt=eyJhbGciOiJIUzI1NiIsInR5cCI6IkpXVCJ9.eyJpc3MiOiJnaXRodWIuY29tIiwiYXVkIjoicmVsZWFzZS1hc3NldHMuZ2l0aHVidXNlcmNvbnRlbnQuY29tIiwia2V5Ijoia2V5MSIsImV4cCI6MTc1MzI3MzM0NywibmJmIjoxNzUzMjczMDQ3LCJwYXRoIjoicmVsZWFzZWFzc2V0cHJvZHVjdGlvbi5ibG9iLmNvcmUud2luZG93cy5uZXQifQ.ryCtWV7KoFS8kCTAJwnsD2yu7bxnnDKHS7-COajVAE0&response-content-disposition=attachment%3B%20filename%3Dprometheus-2.30.0.linux-amd64.tar.gz&response-content-type=application%2Foctet-stream
tar -xvf prometheus-2.30.0.linux-amd64.tar.gz
cd prometheus-2.30.0.linux-amd64
Rename the binary to distinguish it as the agent:
mv prometheus prometheus-agentFor Windows: Download the latest release from the Prometheus download page.
ren prometheus.exe prometheus-agent.exeCreate a configuration file named prometheus-agent.yml. Below is a basic example configuration:
global:
 scrape_interval: 15s

scrape_configs:
 - job_name: 'node_exporter'
 static_configs:
 - targets: ['localhost:9100']

remote_write:
 - url: 'http://central-prometheus-server:9090/api/v1/write'
Ensure Prometheus Agent is running with the specified configuration file.
For Linux/macOS:
./prometheus-agent --config.file=prometheus-agent.yml --web.listen-address=:9095 --agent.modeFor Windows:
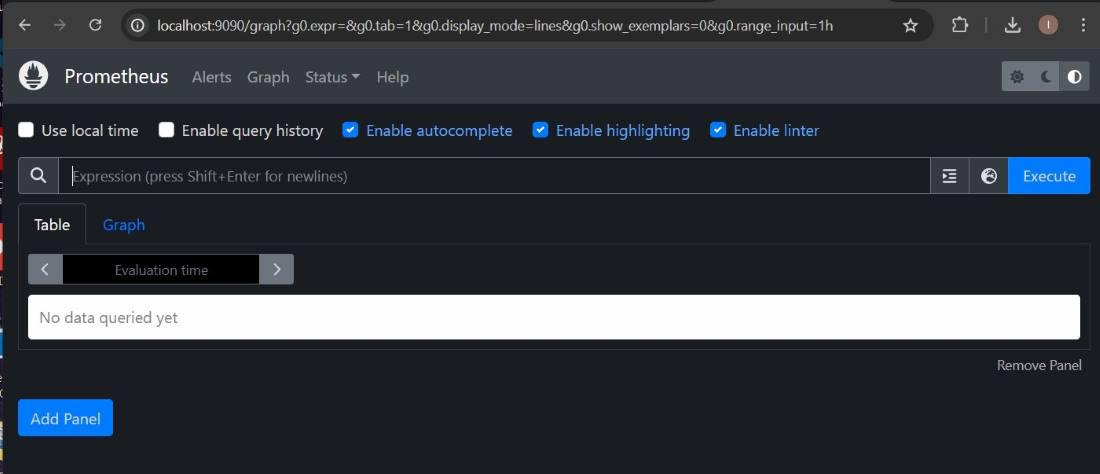
prometheus-agent.exe --config.file=prometheus-agent.yml --web.listen-address=:9095 --agent.modeAccess the Prometheus Agent web interface by navigating to http://localhost:9095 in your web browser. Here, you can check the status of targets and remote write operations.
Prometheus Agent can use service discovery mechanisms to dynamically discover and scrape targets. Below is an example configuration using DNS-based service discovery:
scrape_configs:
 - job_name: 'node_exporter'
 dns_sd_configs:
 - names:
 - 'node-exporter.example.com'
 type: 'A'
 port: 9100
You can configure multiple remote write endpoints and specify advanced options such as queue configuration:
remote_write:
 - url: 'http://central-prometheus-server:9090/api/v1/write'
 queue_config:
 capacity: 2500
 max_shards: 100
 min_shards: 1
 max_samples_per_send: 500
 batch_send_deadline: 5s
 min_backoff: 30ms
 max_backoff: 100ms
In this example, we will monitor metrics from a custom web application that exposes Prometheus metrics.
Ensure your web application exposes metrics at an endpoint (e.g., /metrics). Here is an example using a simple Python web application with the prometheus_client library:
from flask import Flask
from prometheus_client import start_http_server, generate_latest, Summary

app = Flask(__name__)
REQUEST_TIME = Summary('request_processing_seconds', 'Time spent processing request')

@app.route('/')
def hello():
 return "Hello, World!"

@app.route('/metrics')
def metrics():
 return generate_latest()

if __name__ == '__main__':
 start_http_server(8080)
 app.run(port=8081)
Make sure you have Flask and prometheus_client installed. You can install them using pip:
pip install Flask prometheus_clientNavigate to your project directory and run the application:
python app.pyYour application should now be running on localhost:8081, with metrics exposed at localhost:8081/metrics.
File Name: prometheus-agent.yml
Directory: Place this file in the same directory where you will run the Prometheus Agent. For example, this could be ~/prometheus_agent.
global:
 scrape_interval: 15s

scrape_configs:
 - job_name: 'custom_app'
 static_configs:
 - targets: ['localhost:8081']

remote_write:
 - url: 'http://central-prometheus-server:9090/api/v1/write'
This configuration tells Prometheus Agent to scrape metrics from your custom application running on localhost:8081 and forward them to a central Prometheus server at http://central-prometheus-server:9090/api/v1/write.
Navigate to the directory where you placed prometheus-agent.yml and run the Prometheus Agent:
prometheus-agent.exe agent --config.file=prometheus-agent.yml --web.listen-address=:9095Open your browser and navigate to http://localhost:9095. You should see the Prometheus Agent status page.
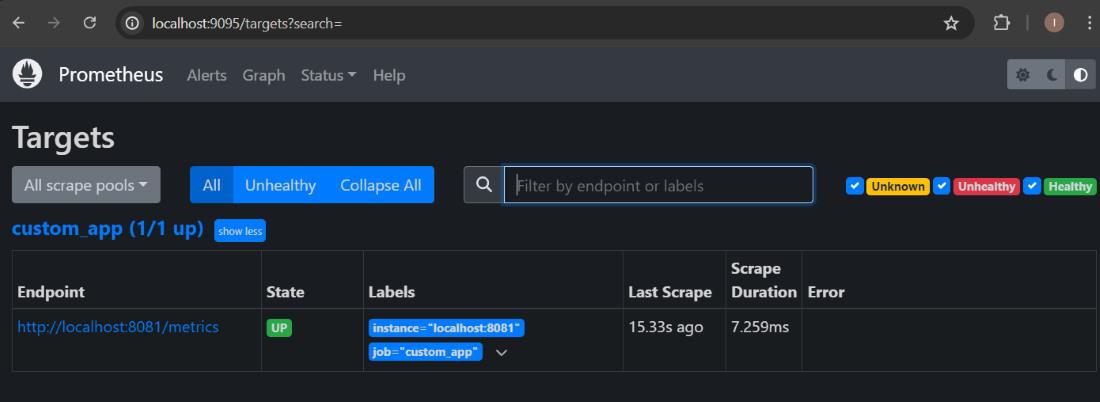
Navigate to http://localhost:9095/targets. You should see the custom_app target listed as UP if it is being successfully scraped.
Run the script to generate traffic:
import requests
import time

for _ in range(100):
 requests.get('http://localhost:8081/process')
 time.sleep(1)
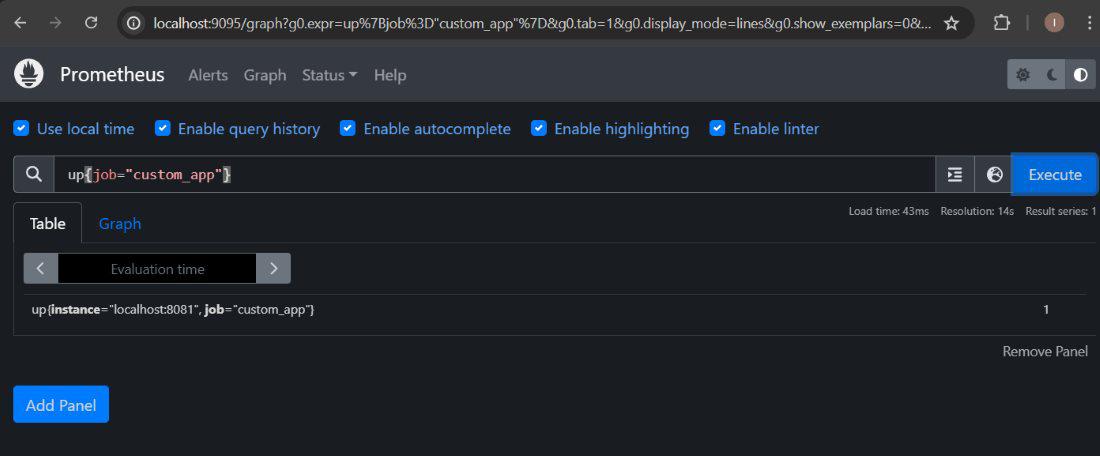
On the central Prometheus server (specified in remote_write), use the query up{job="custom_app"} in the Prometheus expression browser to verify that metrics from your custom application are being forwarded correctly.
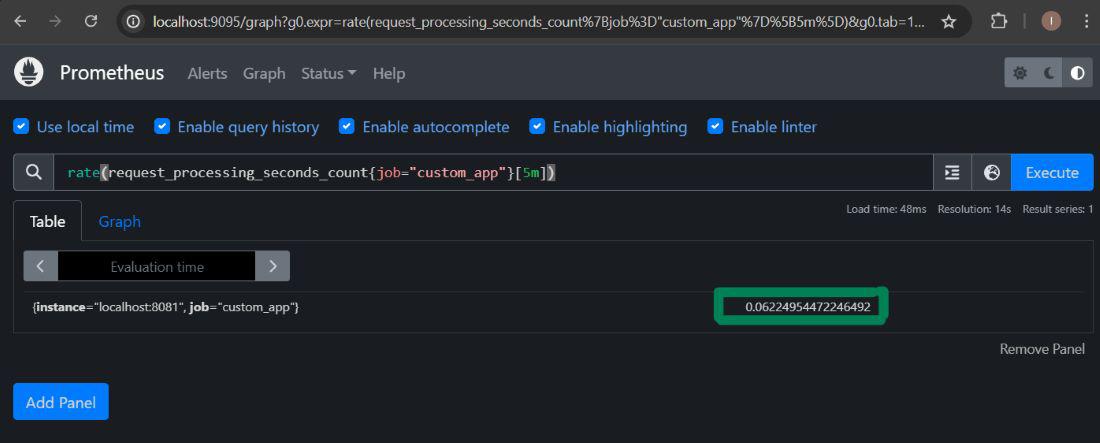
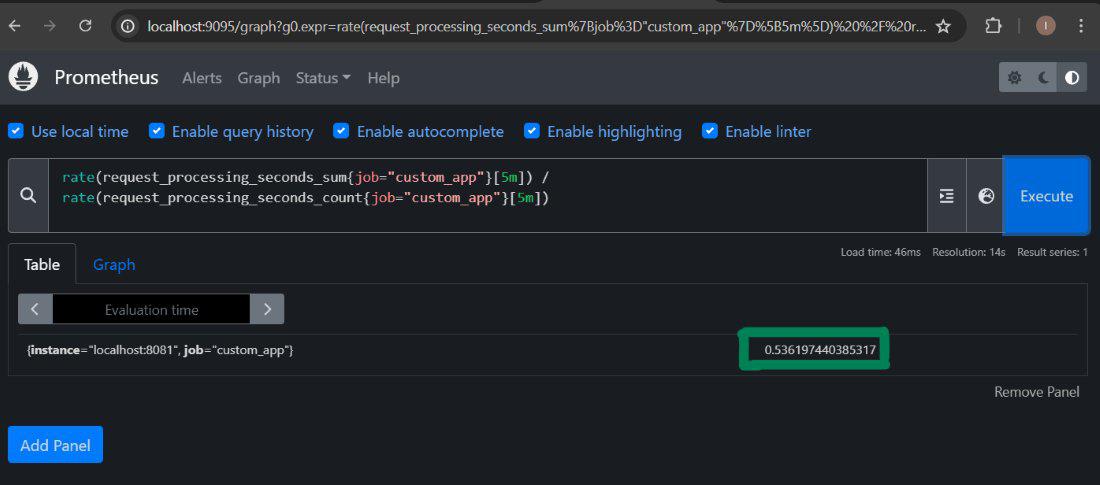
Once the setup is verified and metrics are being scraped and forwarded correctly, you can query metrics using the Prometheus expression browser. Here are a few example queries:
up{job="custom_app"}rate(request_processing_seconds_count{job="custom_app"}[5m])rate(request_processing_seconds_sum{job="custom_app"}[5m]) / rate(request_processing_seconds_count{job="custSo, Prometheus Agent is an interesting addition to the Prometheus universe that adds the ability to scrape and forward metrics without requiring a heavy amount of local storage and rule evaluation capabilities. With these understanding of the primary terminologies, installation process and configuration, one will be in a better place to use Prometheus Agent in environments that have restricted access to resources or distributed monitoring frameworks. Prometheus Agent is convenient when it comes to discovering and managing services with options like dynamic SSD and sophisticated remote write features and configurations needed for a stable and scalable monitoring system.