 |
VOOZH | about |
|
VOOZH | about |
We use cookies to improve your experience on our site. By using our site, you are agreeing to the collection and use of data as described in our Privacy Policy.
Cookie Settings×Table of contents
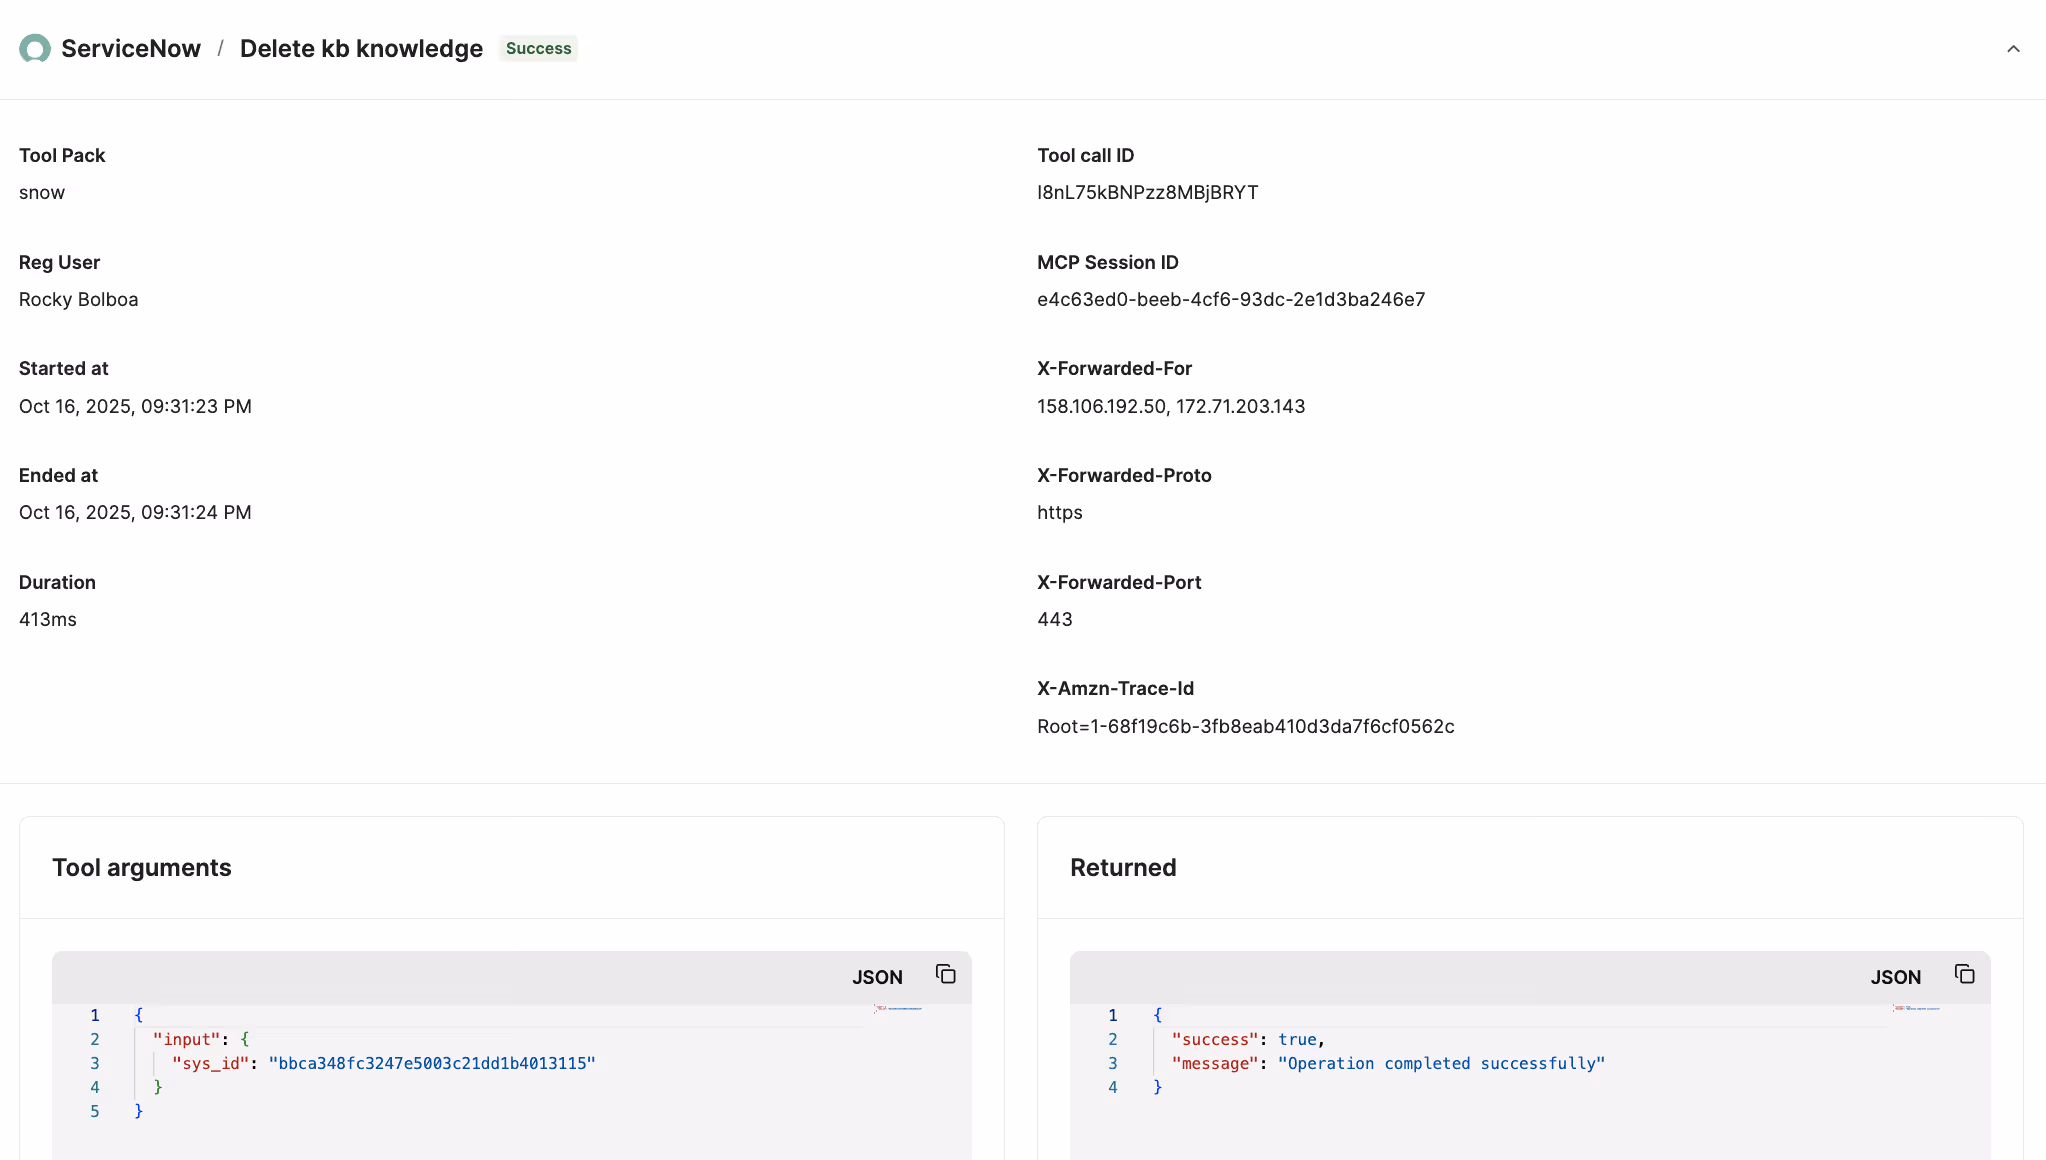
Once you begin integrating your AI agents with Model Context Protocol (MCP) servers' tools, you’ll need clear visibility into the tool calls your agents make to identify and troubleshoot potential security and performance issues.
To that end, we’ll break down how you should observe MCP servers and the 3rd-party tooling that can help. But first, let’s walk through how MCP observability works.
It’s the process of monitoring and reviewing your agents’ tool calls within an MCP server, with the goal of ensuring secure, compliant, and reliable agent behavior.
Performing MCP observability effectively requires several components:
Related: What is AI agent observability?
Here are just a few reasons why you should monitor your agents’ interactions with MCP servers.
By seeing potentially harmful agentic actions on time, your team can address them quickly and before they impact anyone.
Your team can also then address the underlying issues, such as setting policies or rules that prevent your agents from sharing the data externally.
Security and data protection regulations like GDPR require organizations to maintain transparent, easily-accessible records of how sensitive data is accessed and used.
Since MCP observability offers this level of visibility through detailed logs and audit trails, the process of demonstrating compliance over time will be straightforward.
Having visibility on the length of time it takes to make a tool call, whether the right tools are consistently invoked, and how frequently those calls succeed or fail lets you make targeted performance improvements.
This can be setting logic that lets you avoid slow or unreliable tools and tightening prompt routing to reduce mis-invocations.
Many MCP servers were created for marketing purposes; they may not be secure, offer all the tools you need, have comprehensive tool descriptions, and so on.
MCP observability lets you verify when this is the case so you can replace it with a better alternative, quickly.
Related: The challenges of using MCP servers
Here are just a few best practices to follow to observe any MCP server effectively.
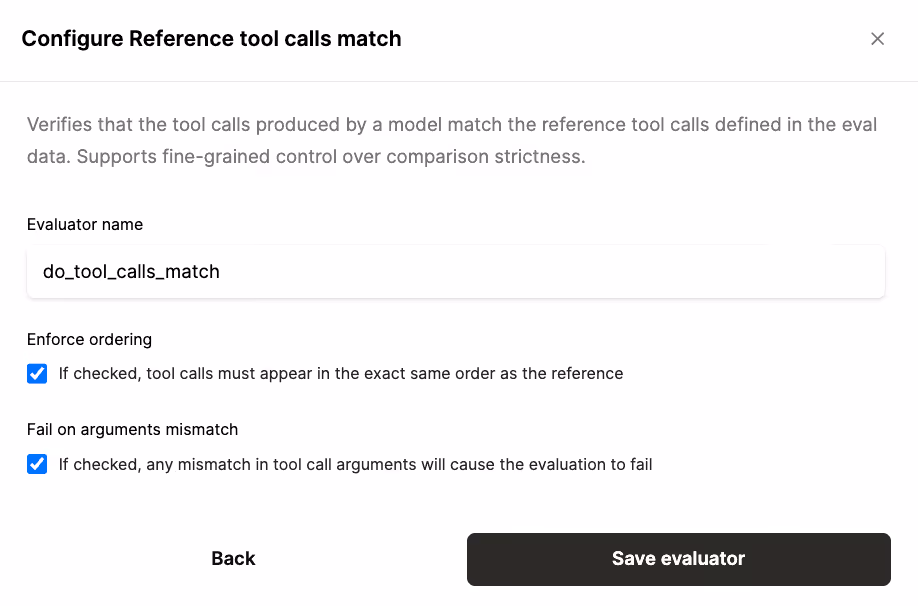
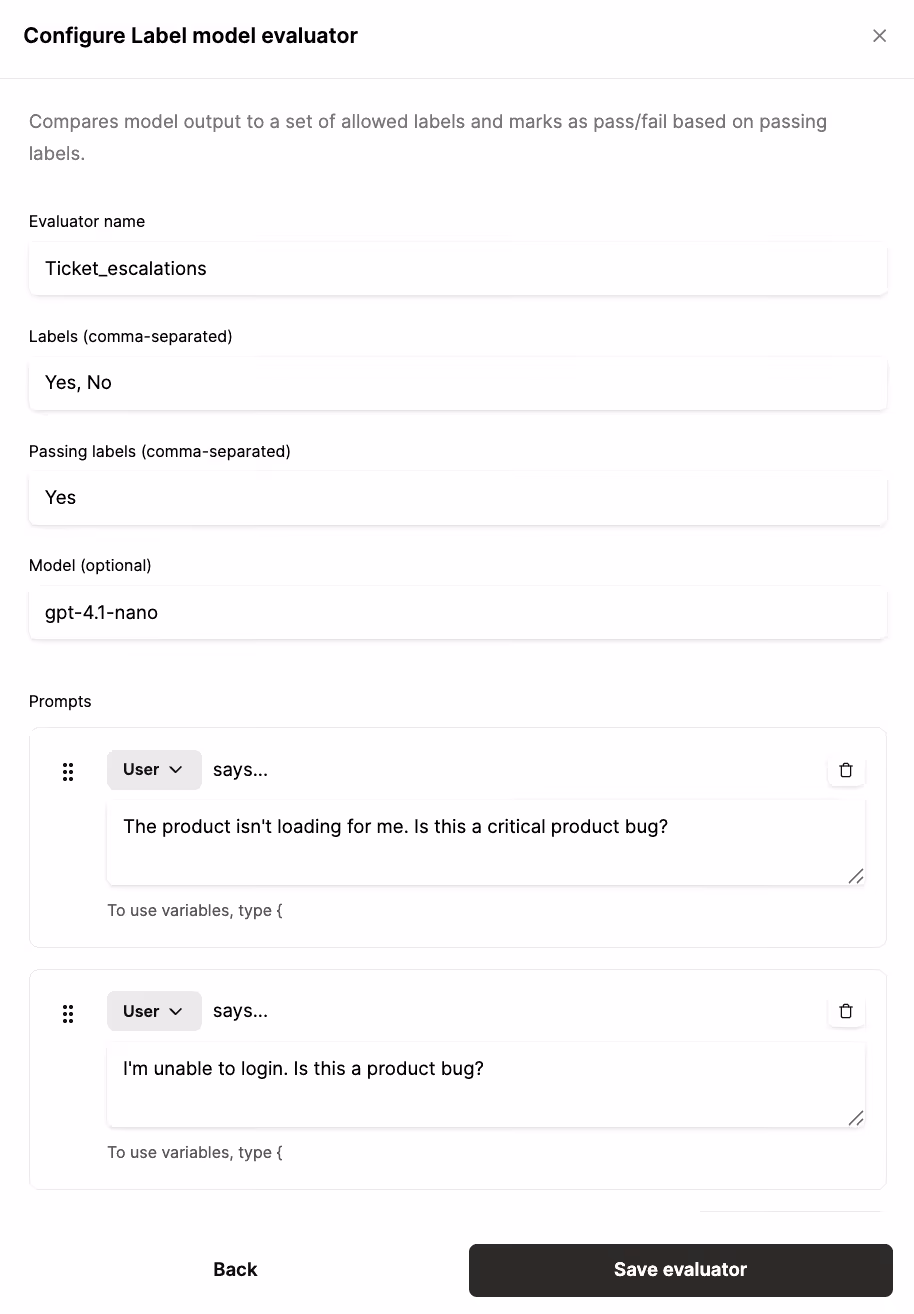
If an action isn’t necessarily bad or actionable but is worth noting, you should set a policy to log it; while if an action would be more problematic and requires immediate attention, you can set a policy to redact sensitive fields or block the call entirely.
For example, if you're using a CRM MCP server, you might set policies to redact sensitive deal amounts or customer contact details to prevent data leaks.
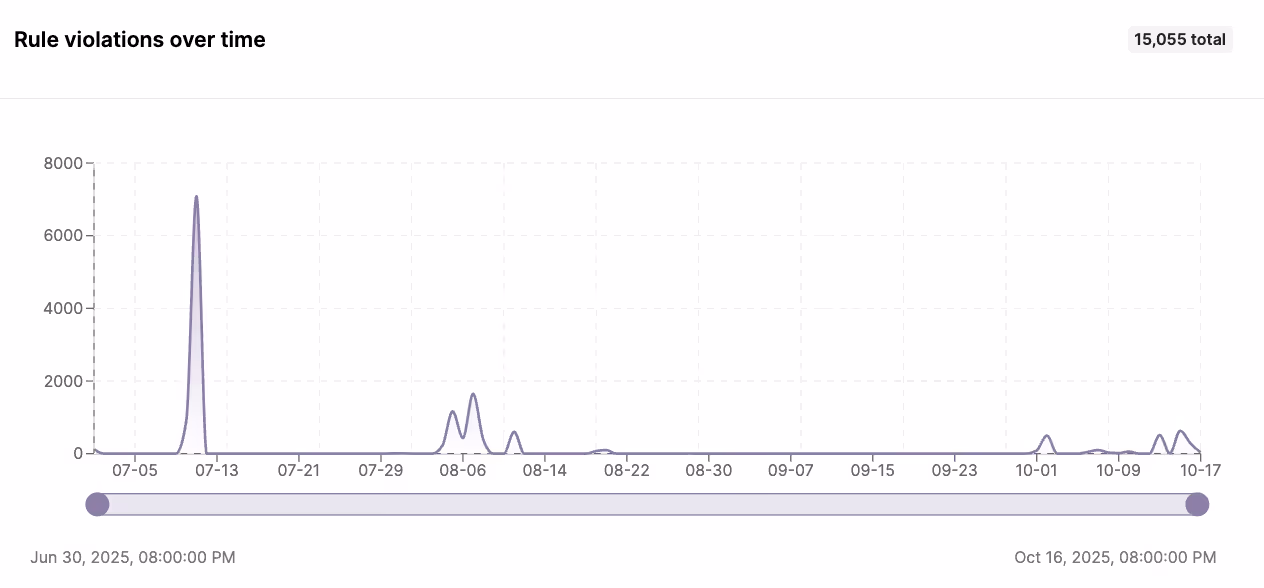
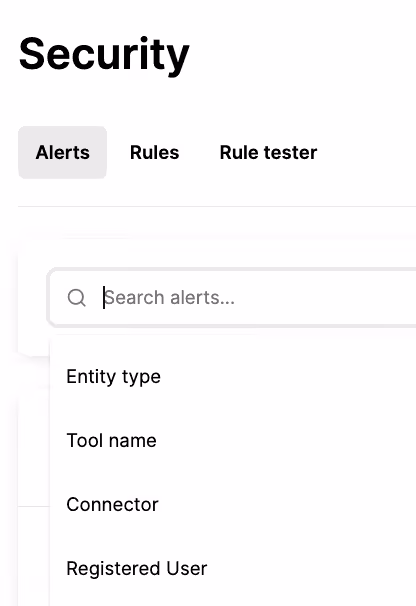
Your MCP observability layer should then capture every tool call along with the evaluated policy and its outcome. This allows you to filter policy violations by severity, blocked actions, or redaction events so your team can investigate and respond quickly.
This requires more work upfront but it saves your team a lot of time and effort in observing and managing tool calls across MCP servers.
You can test any MCP server you plan to use in a number of ways. Here are just a couple of effective methods:
Related: Best practices for building AI agents
Related: How to test your agents
MCP observability requires your engineers to build and maintain custom monitoring pipelines, data ingestion, alerting, and visual UIs with all of the data your security, product and/or IT teams need. All of this distracts your engineers from their core work, like building new agents and improving existing ones.
Purpose-built MCP observability solutions and AI integration platforms, like Merge Agent Handler, take this work off your engineers’ plates and provide the intuitive and powerful features your less technical teams—like PMs and IT—need to monitor and improve any agents’ tool calls.
In addition, a solution like Merge Agent Handler lets you access enterprise-grade, customizable MCP servers and tools to help you securely connect your agents to any tool.
{{this-blog-only-cta}}
In case you have any more questions on MCP observability, we’ve addressed several commonly-asked questions below.
Here’s a relatively simple workflow:
1. Adopt a solution like DataDog to capture structured logs from your MCP servers (e.g., tool-call start/stop, duration, success/failure, etc.), plus custom metrics (e.g., error rate) and traces.
2. Using a tool like Zapier, you can automatically send logs with issues to a specific Slack Channel (or a similar tool) and create tickets in your dev team’s project management tool (e.g., GitHub). Both the tickets and Slack posts can include deep links to the traces/logs and reproducible payloads.
3. Build a separate automation in Zapier where whenever a developer changes the issue status (e.g., moves to “In Progress” or “Fixed”), automatically post an update back to the original Slack thread. Likewise, when a Slack incident thread is resolved, auto-close or comment on the linked ticket to keep systems in sync.
There’s additional steps you’ll need to take. For example, you’ll likely want to build a holistic dashboard that provides insights on the tool calls that’ve been made, the rule violations that’ve occurred, and the MCP servers that are currently in use.
Note: You can use a solution like Merge Agent Handler to take significant parts of this work off your team’s plate.
MCP monitoring lets you track tool calls for predefined scenarios, such as expected error messages.
MCP observability includes monitoring but also provides the context you need to understand why something went wrong via logs, metrics and traces. From there, your team has the context needed to take corrective actions.
It defines how your team collects, analyzes, and acts on data from your MCP servers, which can include logs, metrics, and traces.
Your framework should outline the data that’s captured, where it lives, who can access it, and how different scenarios, like errors, slowdowns, or cost spikes, should be detected and resolved.
You can evaluate Merge Agent Hander’s observability features and tool-calling capabilities by signing up for a free account.
.avif)
.avif)
.png)