Many climate change impacts have been observed in the first decades of the 21st century, with 2024 the warmest on record at +1.60 °C (2.88 °F) since regular tracking began in 1850. Additional warming will increase these impacts and can trigger tipping points, such as melting all of the Greenland ice sheet. Under the 2015 Paris Agreement, nations collectively agreed to keep warming "well under 2 °C". However, with pledges made under the Agreement, global warming would still reach about 2.8 °C (5.0 °F) by the end of the century.
The sea level has been rising since the end of the Last Glacial Maximum, which was around 20,000 years ago. Between 1901 and 2018, the average sea level rose by 15–25 cm (6–10 in), with an increase of 2.3 mm (0.091 in) per year since the 1970s. This was faster than the sea level had ever risen over at least the past 3,000 years. The rate accelerated to 4.62 mm (0.182 in)/yr for the decade 2013–2022. Climate change due to human activities is the main cause of this persistent acceleration. Between 1993 and 2018, melting ice sheets and glaciers accounted for 44% of sea level rise, with another 42% resulting from thermal expansion of water.
Sea level rise lags behind changes in the Earth's temperature by decades, and sea level rise will therefore continue to accelerate between now and 2050 in response to warming that has already happened. What happens after that depends on future human greenhouse gas emissions. If there are very deep cuts in emissions, sea level rise would slow between 2050 and 2100. The reported factors of increase in flood hazard potential are often exceedingly large, ranging from 10 to 1000 for even modest sea-level rise scenarios of 0.5 m or less. It could then rise by between 30 cm (1 ft) and 1.0 m (3+1⁄3 ft) between the early 2020s and 2100, or by approximately 60 cm (2 ft) to 130 cm (4+1⁄2 ft) from the 19th century to 2100. With high emissions it would instead accelerate further, and could rise by 50 cm (1.6 ft) or even by 1.9 m (6.2 ft) by 2100. In the long run, sea level rise would amount to 2–3 m (7–10 ft) over the next 2000 years if warming stays to its current 1.5 °C (2.7 °F) over the pre-industrial past. It would be 19–22 metres (62–72 ft) if warming peaks at 5 °C (9.0 °F).
Rising seas affect every coastal population on Earth. This can be through flooding, higher storm surges, king tides, and increased vulnerability to tsunamis. There are many knock-on effects. They lead to loss of coastal ecosystems such as mangrove swamps. There may be a reduction in crop yields because of increasing salt levels in irrigation water. Damage to ports disrupts sea trade. The sea level rise projected by 2050 will expose places currently inhabited by tens of millions of people to annual flooding. Without a sharp reduction in greenhouse gas emissions, this may increase to hundreds of millions in the latter decades of the century. (Full article...)
Measuring snowpack in a crevasse on the Easton Glacier, North Cascades, USA. The two-dimensional nature of the annual layers is apparent. Crucial to the survival of a glacier is its mass balance, the difference between accumulation and ablation (melting and sublimation). Climate change may cause variations in both temperature and snowfall, causing changes in mass balance.
Silva was a member of the PT until 2009, and served as a senator before becoming Minister of the Environment in 2003. She ran for president in the 2010 Brazilian elections as the candidate for the Green Party, coming in 3rd with 19% of the first-round vote. In April 2014, Eduardo Campos announced his candidacy for the fall 2014 presidential election, naming Marina Silva as his vice presidential candidate. After Campos's death in a plane crash on August, she was selected to run as the Socialist Party's candidate for the presidency, winning 21% of the vote and coming in 3rd. She again ran for president in the 2018 election, this time as the nominee for the Sustainability Network, finishing in 8th place with 1% of the vote.
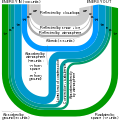
Image 1A Sankey diagram illustrating a balanced example of Earth's energy budget. Line thickness is linearly proportional to relative amount of energy. (from Earth's energy budget)
Image 2Annual CO2 flows from anthropogenic sources (left) into Earth's atmosphere, land, and ocean sinks (right) since year 1960. Units in equivalent gigatonnes carbon per year. (from Carbon dioxide in the atmosphere of Earth)
Image 3Air pollution has substantially increased the presence of aerosols in the atmosphere when compared to the preindustrial background levels. Different types of particles have different effects, but overall, cooling from aerosols formed by sulfur dioxide emissions has the overwhelming impact. However, the complexity of aerosol interactions in atmospheric layers makes the exact strength of cooling very difficult to estimate. (from Causes of climate change)
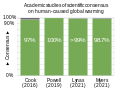
Image 4Scientific consensus on causation:Academic studies of scientific agreement on human-caused global warming among climate experts (2010–2015) reflect that the level of consensus correlates with expertise in climate science. A 2019 study found scientific consensus to be at 100%, and a 2021 study concluded that consensus exceeded 99%. Another 2021 study found that 98.7% of climate experts indicated that the Earth is getting warmer mostly because of human activity. (from History of climate change science)
Image 5The growth in Earth's energy imbalance from satellite and in situ measurements (2005–2019). A rate of +1.0 W/m2 summed over the planet's surface equates to a continuous heat uptake of about 500 terawatts (~0.3% of the incident solar radiation). (from Earth's energy budget)
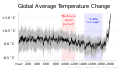
Image 9Observed temperature from NASA vs the 1850–1900 average used by the IPCC as a pre-industrial baseline. The primary driver for increased global temperatures in the industrial era is human activity, with natural forces adding variability. (from Causes of climate change)
Image 11Sea ice reflects 50% to 70% of incoming sunlight, while the ocean, being darker, reflects only 6%. As an area of sea ice melts and exposes more ocean, more heat is absorbed by the ocean, raising temperatures that melt still more ice. This is a positive feedback process. (from Causes of climate change)
Image 13Extreme event attribution methods generally involve applying climate change models to scenarios in both the "real" world that is experiencing global warming, and a simulated world that does not suffer the drivers of global warming. Differences between the results of the two processes—especially the frequency, intensity and impacts of extreme weather events—are then analyzed to arrive at the attribution result. (from History of climate change science)
Image 15Earth's energy balance and imbalance, showing where the excess energy goes: Outgoing radiation is decreasing owing to increasing greenhouse gases in the atmosphere, leading to Earth's energy imbalance of about 460 TW. The percentage going into each domain of the climate system is also indicated. (from Earth's energy budget)
Image 20The rising accumulation of energy in the oceanic, land, ice, and atmospheric components of Earth's climate system since 1960 (from Earth's energy budget)
Image 21Mean temperature anomalies during the period 1965 to 1975 with respect to the average temperatures from 1937 to 1946. This dataset was not available at the time. (from History of climate change science)
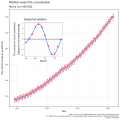
Image 22Carbon dioxide observations from 2008 to 2017 showing the seasonal variations and the difference between northern and southern hemispheres (from Carbon dioxide in the atmosphere of Earth)
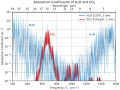
Image 24CO2 reduces the flux of thermal radiation emitted to space (causing the large dip near 667 cm−1), thereby contributing to the greenhouse effect. (from Carbon dioxide in the atmosphere of Earth)
Image 25Human fingerprints for global warming (summary of observational evidence that human carbon dioxide emissions are causing the climate to warm). (from Causes of climate change)
Image 29Earth's energy budget (in W/m2) determines the climate. It is the balance of incoming and outgoing radiation and can be measured by satellites. The Earth's energy imbalance is the "net absorbed" energy amount. (from Earth's energy budget)
Image 33The impact of the greenhouse effect on climate was presented to the public early in the 20th century, as succinctly described in this 1912 Popular Mechanics article. (from History of climate change science)
Image 35Top panel: Observed global average temperature change (1870— ).Bottom panel: Data from the Fourth National Climate Assessment is merged for display on the same scale to emphasize relative strengths of forces affecting temperature change. Human-caused forces have increasingly dominated. (from Causes of climate change)
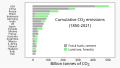
Image 36Between 1850 and 2019 the Global Carbon Project estimates that about 2/3rds of excess carbon dioxide emissions have been caused by burning fossil fuels, and a little less than half of that has stayed in the atmosphere. (from Carbon dioxide in the atmosphere of Earth)
Image 38Global average temperatures show that the Medieval Warm Period was not a planet-wide phenomenon, and that the Little Ice Age was not a distinct planet-wide time period but rather the end of a long temperature decline that preceded recent global warming. (from Temperature record of the last 2,000 years)
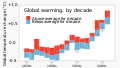
Image 39Since the 1980s, global average surface temperatures during a given decade have almost always been higher than the average temperature in the preceding decade. (from History of climate change science)
Image 40Earth's energy imbalance has increased in the 21st century, reaching values twice that of prior estimates from the IPCC. The ability to observe this imbalance is deteriorating because satellites are being decommissioned. (from Earth's energy budget)
Image 42Erratics, boulders deposited by glaciers far from any existing glaciers, led geologists to the conclusion that climate had changed in the past. (from History of climate change science)
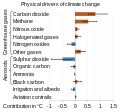
Image 43Brown bars indicate drivers that increase global warming, and blue bars indicate those that decrease global warming. Future global warming potential for long lived drivers like carbon dioxide emissions is not represented. (from Causes of climate change)
Image 44Warming influence of atmospheric greenhouse gases has nearly doubled since 1979, with carbon dioxide and methane being the dominant drivers. (from Causes of climate change)
Image 45The rate of global tree cover loss has approximately doubled since 2001, to an annual loss approaching an area the size of Italy. (from Causes of climate change)
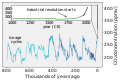
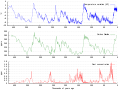
Image 46Over 400,000 years of ice core data: Graph of CO2 (green), reconstructed temperature (blue) and dust (red) from the Vostok ice core (from Carbon dioxide in the atmosphere of Earth)
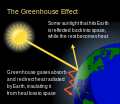
Image 49Greenhouse gases allow sunlight to pass through the atmosphere, heating the planet, but then absorb and redirect the infrared radiation (heat) the planet emits. (from Carbon dioxide in the atmosphere of Earth)
Image 51Energy flows between space, the atmosphere, and Earth's surface. Rising greenhouse gas levels are contributing to an energy imbalance. (from Causes of climate change)
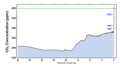
Image 54CO2 sources and sinks since 1880. While there is little debate that excess carbon dioxide in the industrial era has mostly come from burning fossil fuels, the future strength of land and ocean carbon sinks is an area of study. (from Causes of climate change)
Image 60Terms like "climate emergency" and climate crisis" have often been used by activists, and are increasingly found in academic papers. (from History of climate change science)
Image 61This diagram of the carbon cycle shows the movement of carbon between land, atmosphere, and oceans in billions of metric tons of carbon per year. Yellow numbers are natural fluxes, red are human contributions, white are stored carbon. (from Carbon dioxide in the atmosphere of Earth)
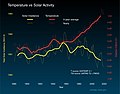
Image 62Modeled simulation of the effect of various factors (including GHGs, Solar irradiance) singly and in combination, showing in particular that solar activity produces a small and nearly uniform warming, unlike what is observed. (from History of climate change science)
... that global warming is cited as the main reason why southern England is becoming suitable for wine production and that it has similar soils and latitude to the Champagne region of France?
(Pictured left: A vineyard in Wyken, a suburb of Coventry, England)

_(cropped).jpg)
_at_the_top_of_the_atmosphere_(TOA).png)
.jpg)
.svg)
.svg)
.png)