 |
VOOZH | about |
|
VOOZH | about |
OpenAI Canvas is a versatile tool designed to streamline collaborative coding and text editing. With its intuitive interface, Canvas offers a dynamic platform for developers to write, edit, and debug code alongside ChatGPT’s AI-driven assistance. This makes it particularly useful for a wide range of tasks, from basic scripting to managing complex projects. In this article, I will explore coding with Canvas and share my overall experience.
Checkout – Why o1 Model Better than GPT-4o
I explored the coding features of Canvas with the goal of attaching a dataset and performing basic exploratory data analysis (EDA). While the interface was intuitive and promising, I encountered challenges in integrating external datasets.
When attempting to attach a dataset, I found that the sandbox environment could not access the file. As a workaround, I pasted a subset of the data directly into Canvas, but this did not resolve the issue. Even with correctly written code, an error message persisted, indicating that the data could not be found. This limitation highlights the need for enhanced data integration capabilities within Canvas.
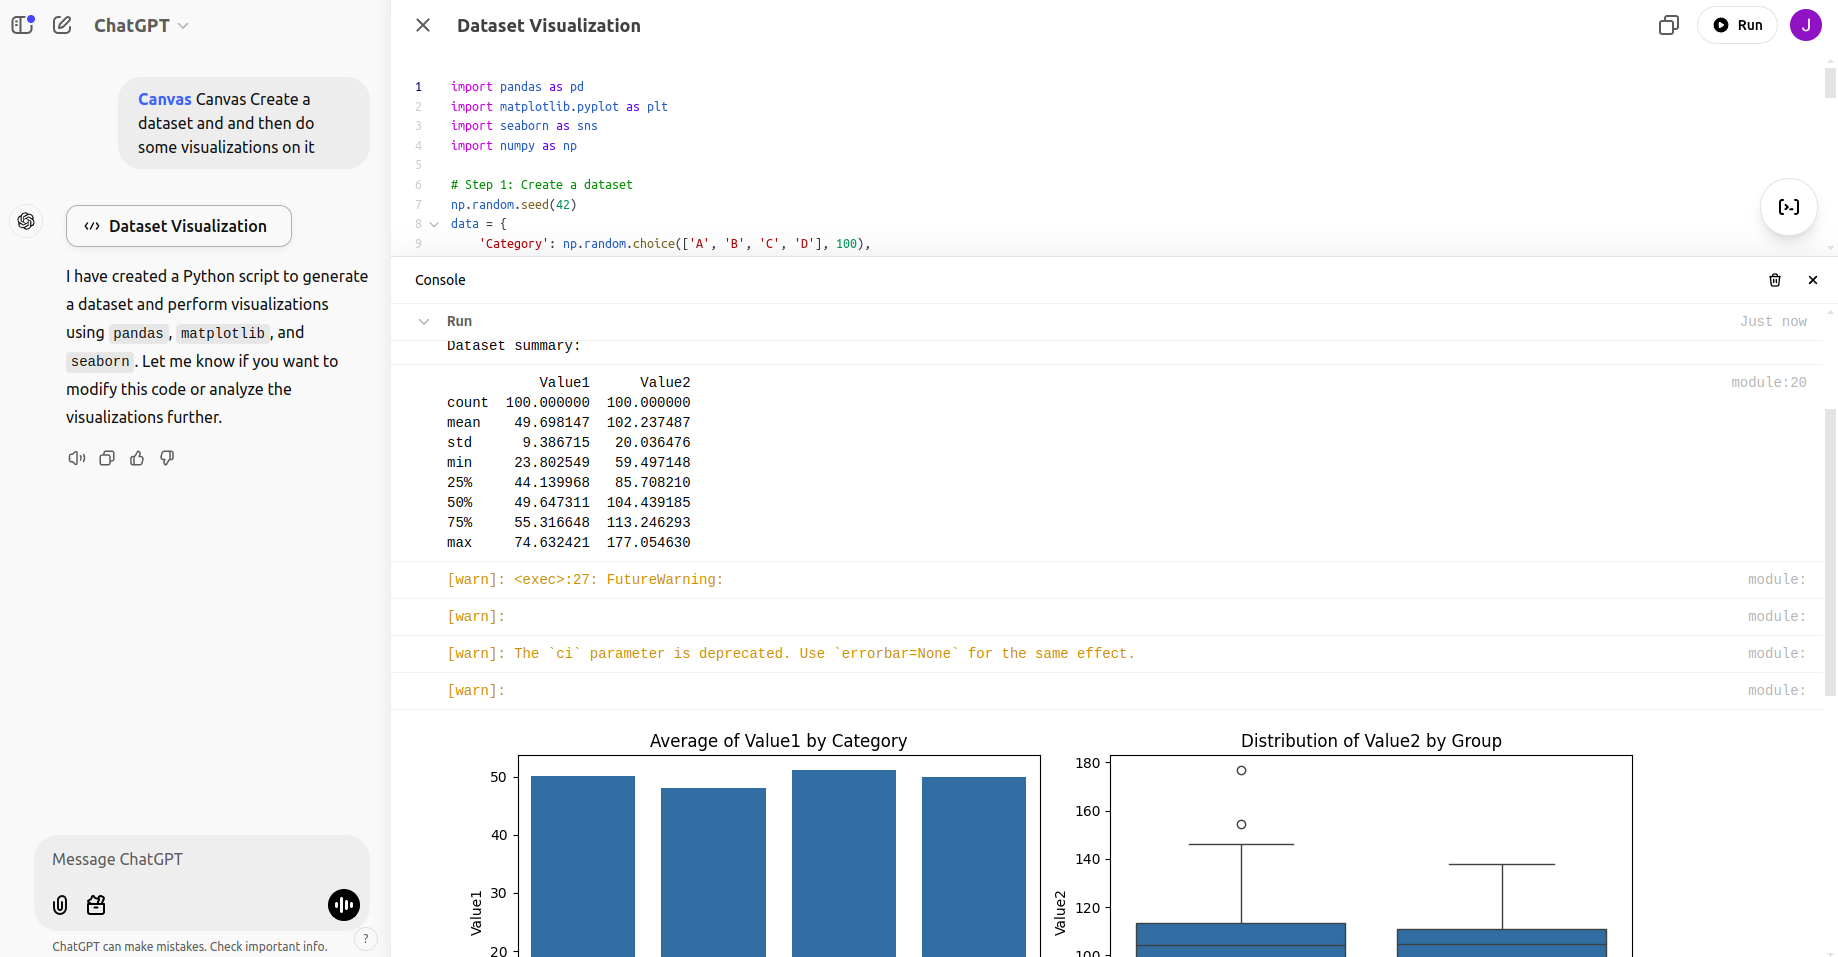
After encountering these limitations, I prompted Canvas to generate synthetic data and perform visualizations. The following code was generated and executed successfully:
Prompt: Create a dataset and and then do some visualizations on it.
import pandas as pd
import matplotlib.pyplot as plt
import seaborn as sns
import numpy as np
# Step 1: Create a dataset
np.random.seed(42)
data = {
'Category': np.random.choice(['A', 'B', 'C', 'D'], 100),
'Value1': np.random.normal(50, 10, 100),
'Value2': np.random.normal(100, 20, 100),
'Group': np.random.choice(['X', 'Y'], 100)
}
df = pd.DataFrame(data)
# Step 2: Display basic information about the dataset
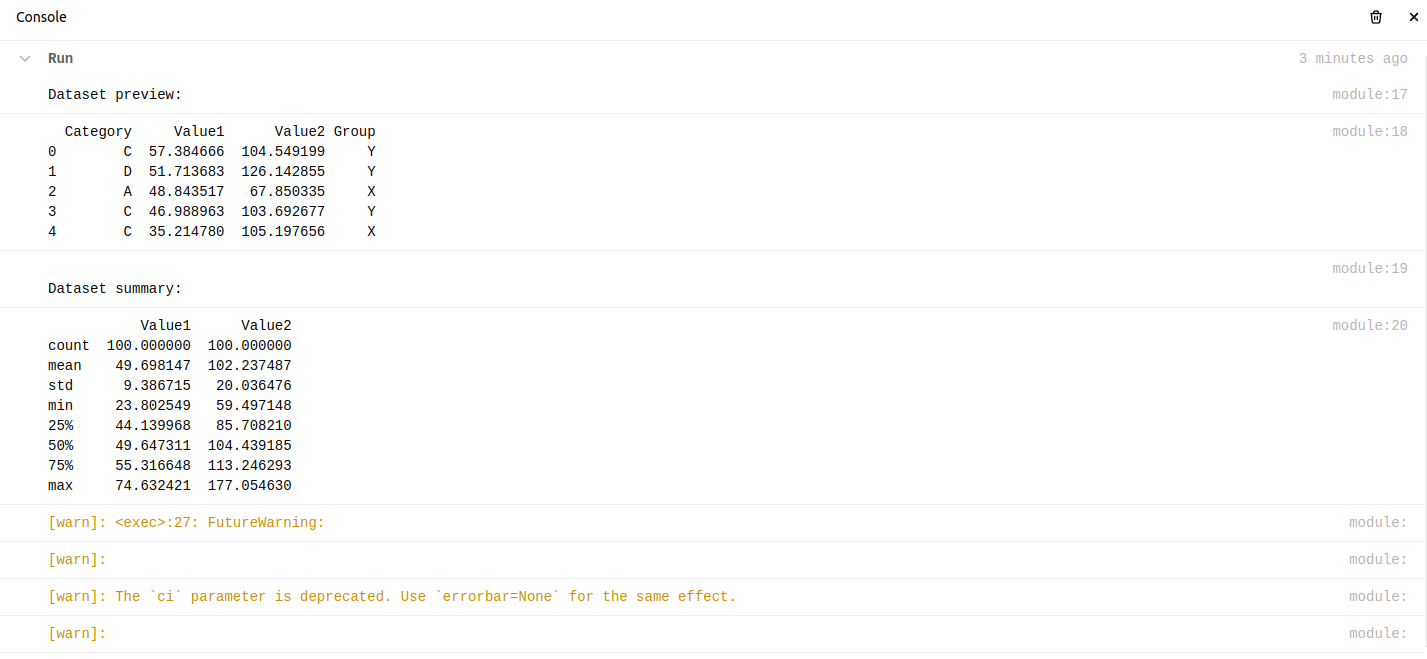
print("Dataset preview:")
print(df.head())
print("\nDataset summary:")
print(df.describe())
# Step 3: Visualizations
plt.figure(figsize=(12, 8))
# Bar plot: Average of Value1 by Category
plt.subplot(2, 2, 1)
sns.barplot(x='Category', y='Value1', data=df, ci=None)
plt.title('Average of Value1 by Category')
# Box plot: Distribution of Value2 by Group
plt.subplot(2, 2, 2)
sns.boxplot(x='Group', y='Value2', data=df)
plt.title('Distribution of Value2 by Group')
# Scatter plot: Value1 vs. Value2
plt.subplot(2, 2, 3)
sns.scatterplot(x='Value1', y='Value2', hue='Category', data=df)
plt.title('Scatter plot of Value1 vs Value2')
# Histogram: Distribution of Value1
plt.subplot(2, 2, 4)
sns.histplot(df['Value1'], kde=True, bins=20)
plt.title('Histogram of Value1')
plt.tight_layout()
plt.show()
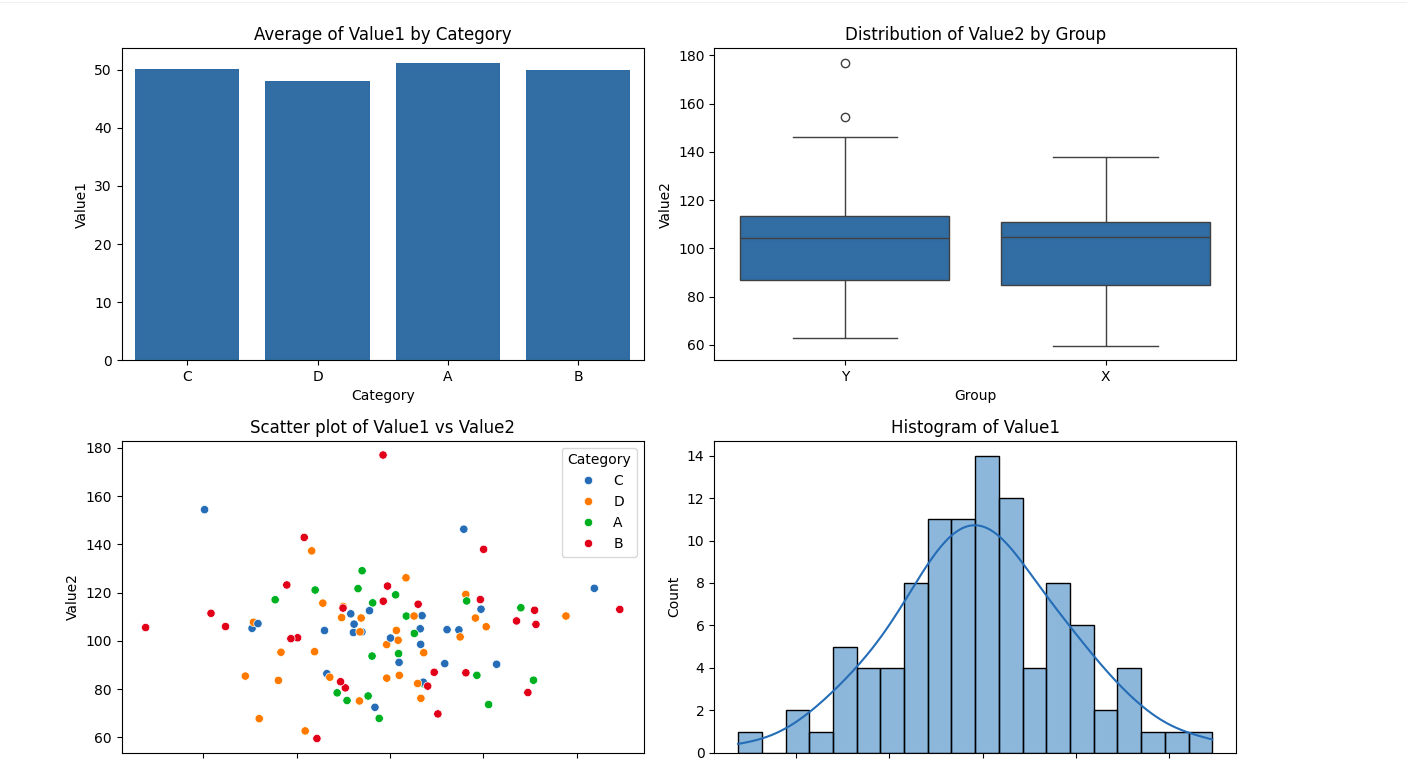
And upon run this was the output:
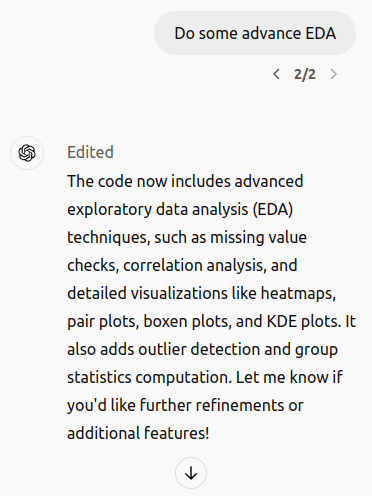
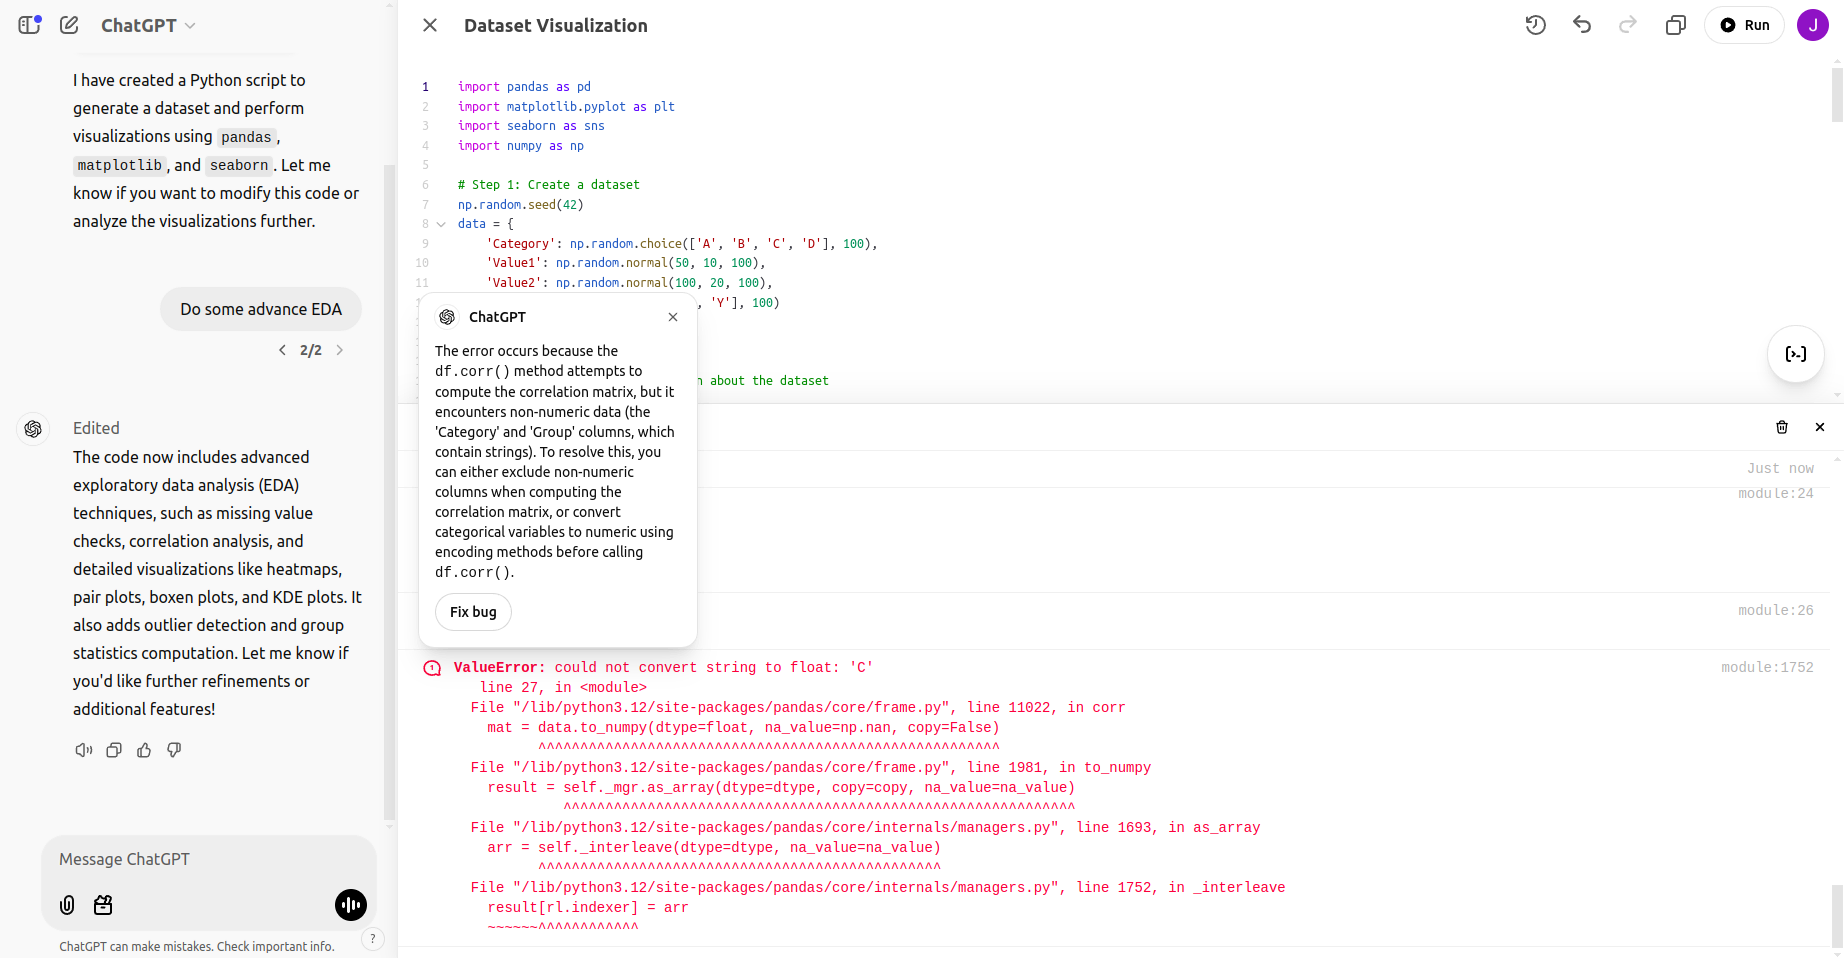
The results were visually informative, showcasing the platform’s ability to handle basic EDA tasks effectively. Following this, I performed advanced EDA to uncover deeper insights:
While running this advance EDA I got this bug:
After fixing the bug:
import pandas as pd
import matplotlib.pyplot as plt
import seaborn as sns
import numpy as np
# Step 1: Create a dataset
np.random.seed(42)
data = {
'Category': np.random.choice(['A', 'B', 'C', 'D'], 100),
'Value1': np.random.normal(50, 10, 100),
'Value2': np.random.normal(100, 20, 100),
'Group': np.random.choice(['X', 'Y'], 100)
}
df = pd.DataFrame(data)
# Step 2: Display basic information about the dataset
print("Dataset preview:")
print(df.head())
print("\nDataset summary:")
print(df.describe())
# Advanced EDA
print("\nChecking for missing values:")
print(df.isnull().sum())
# Ensure only numeric data is used for correlation matrix
print("\nCorrelation matrix:")
numeric_df = df.select_dtypes(include=[np.number])
correlation_matrix = numeric_df.corr()
print(correlation_matrix)
# Visualizations for advanced EDA
plt.figure(figsize=(15, 12))
# Heatmap of correlation matrix
plt.subplot(3, 2, 1)
sns.heatmap(correlation_matrix, annot=True, cmap='coolwarm', fmt='.2f')
plt.title('Correlation Matrix Heatmap')
# Pairplot for relationships
sns.pairplot(df, hue='Category', corner=True, diag_kind='kde')
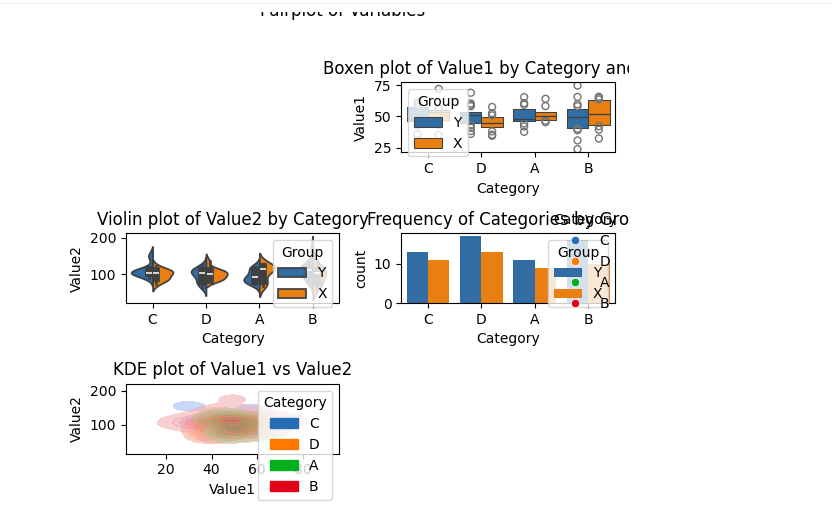
plt.suptitle('Pairplot of Variables', y=1.02)
plt.show()
# Boxen plot: Distribution of Value1 by Category and Group
plt.subplot(3, 2, 2)
sns.boxenplot(x='Category', y='Value1', hue='Group', data=df)
plt.title('Boxen plot of Value1 by Category and Group')
# Violin plot: Distribution of Value2 by Category
plt.subplot(3, 2, 3)
sns.violinplot(x='Category', y='Value2', data=df, hue='Group', split=True)
plt.title('Violin plot of Value2 by Category')
# Count plot: Frequency of Categories
plt.subplot(3, 2, 4)
sns.countplot(x='Category', data=df, hue='Group')
plt.title('Frequency of Categories by Group')
# KDE plot: Distribution of Value1 and Value2
plt.subplot(3, 2, 5)
sns.kdeplot(x='Value1', y='Value2', hue='Category', data=df, fill=True, alpha=0.6)
plt.title('KDE plot of Value1 vs Value2')
plt.tight_layout()
plt.show()
# Outlier detection
print("\nIdentifying potential outliers:")
for column in ['Value1', 'Value2']:
Q1 = df[column].quantile(0.25)
Q3 = df[column].quantile(0.75)
IQR = Q3 - Q1
lower_bound = Q1 - 1.5 * IQR
upper_bound = Q3 + 1.5 * IQR
outliers = df[(df[column] < lower_bound) | (df[column] > upper_bound)]
print(f"Outliers in {column}:\n", outliers)
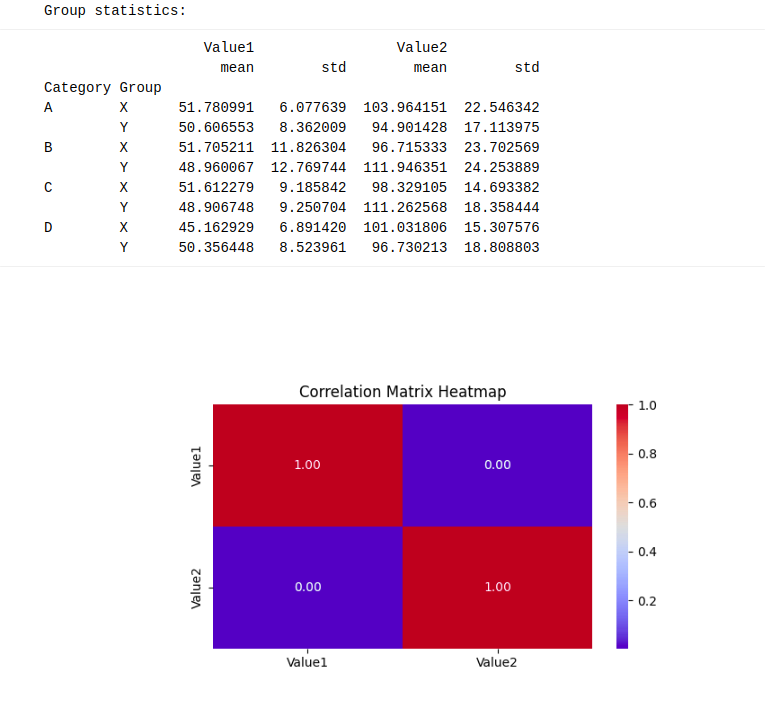
# Group statistics
print("\nGroup statistics:")
print(df.groupby(['Category', 'Group']).agg({'Value1': ['mean', 'std'], 'Value2': ['mean', 'std']}))
These advanced analyses highlighted Canvas’s capabilities for exploratory tasks but also underscored the platform’s limitations in integrating external datasets.
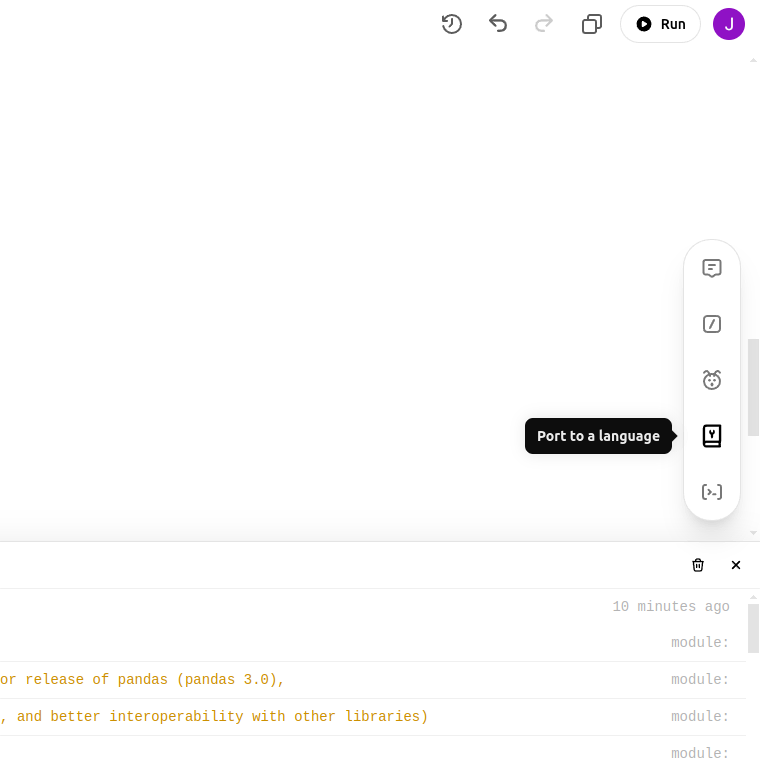
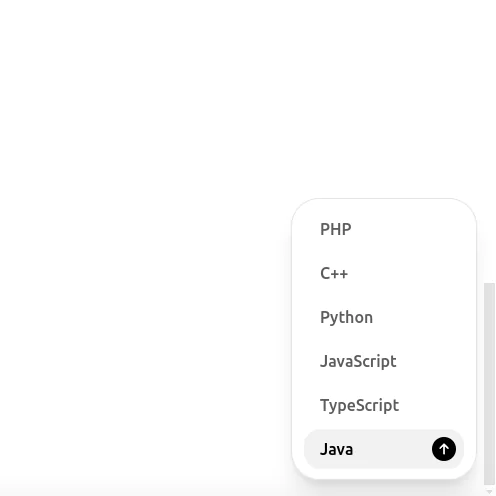
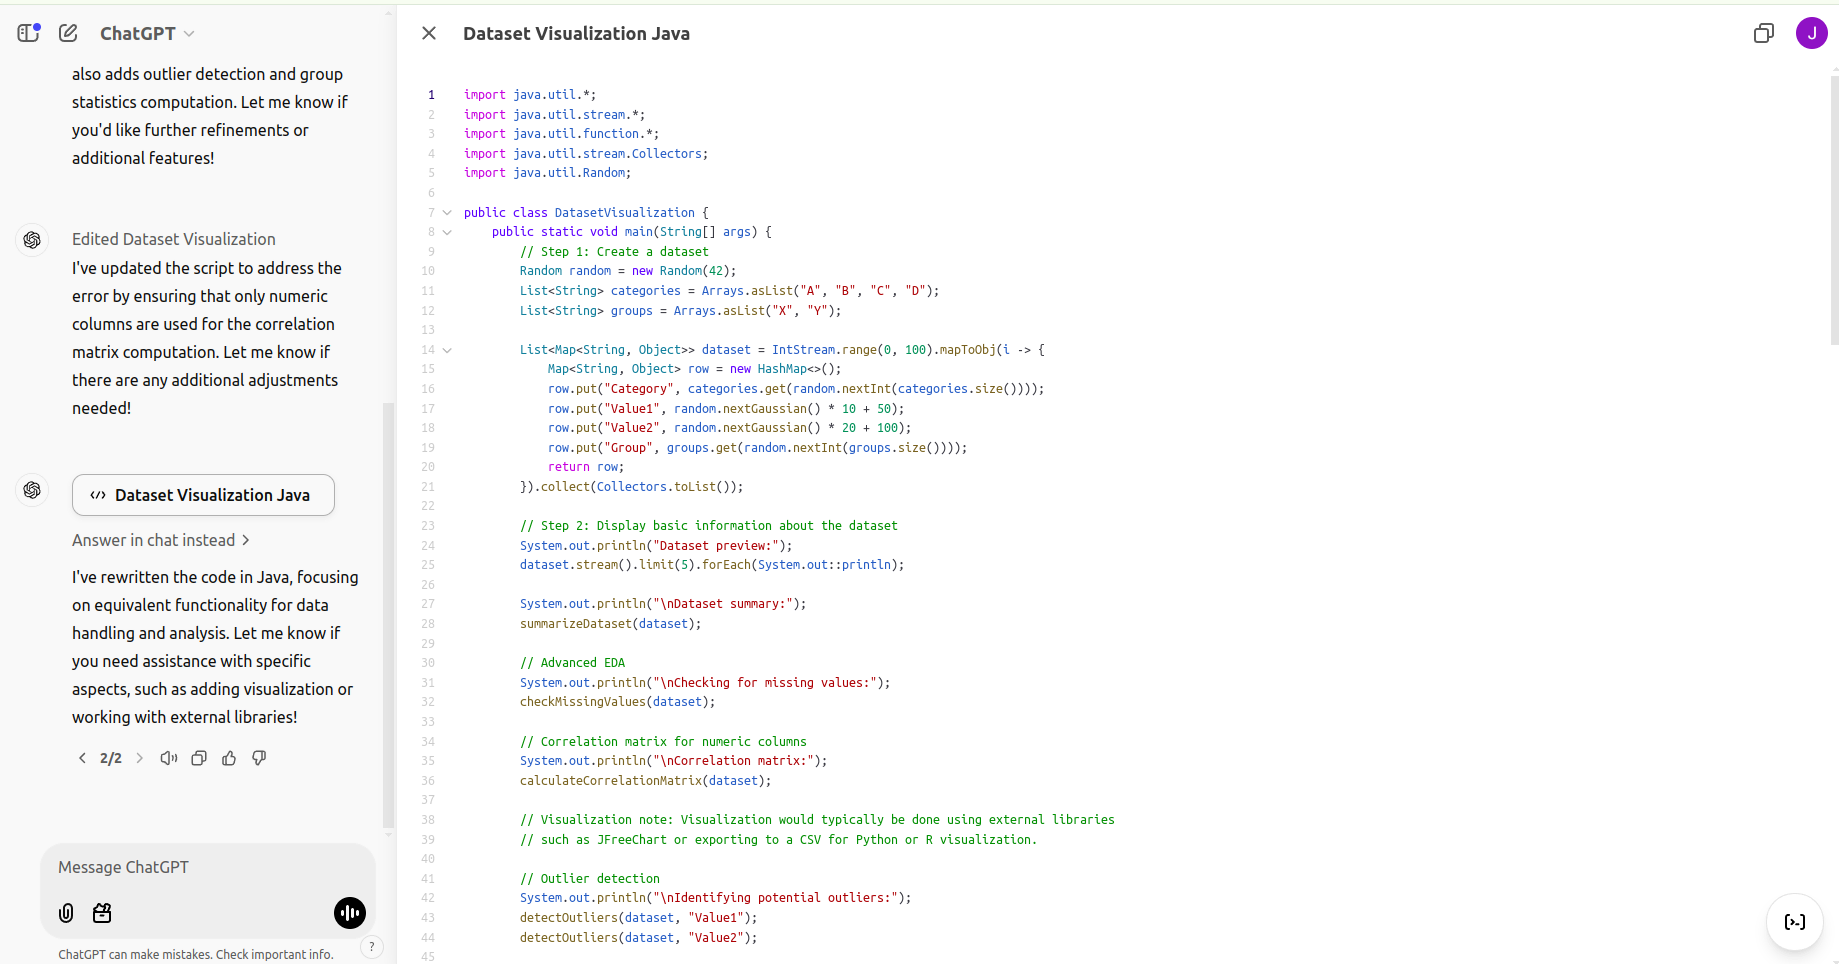
While Canvas supports coding primarily in python, the platform allows users to port python code to other languages, such as java. However, it does not execute code in languages other than Python. Here is an example of a Python-to-Java port:
import java.util.*;
import java.util.stream.Collectors;

public class DatasetVisualization {

 public static void main(String[] args) {
 // Step 1: Create a synthetic dataset
 Random random = new Random(42); // For reproducibility

 List<Integer> ages = random.ints(200, 18, 70).boxed().collect(Collectors.toList());
 List<Integer> incomes = random.ints(200, 30000, 120000).boxed().collect(Collectors.toList());
 List<String> genders = random.ints(200, 0, 2).mapToObj(i -> i == 0 ? "Male" : "Female").collect(Collectors.toList());
 List<Integer> spendScores = random.ints(200, 1, 101).boxed().collect(Collectors.toList());
 List<String> cities = random.ints(200, 0, 5).mapToObj(i -> {
 switch (i) {
 case 0: return "New York";
 case 1: return "Los Angeles";
 case 2: return "Chicago";
 case 3: return "Houston";
 default: return "Phoenix";
 }
 }).collect(Collectors.toList());

 // Step 2: Create demographic segments
 List<String> ageGroups = ages.stream().map(age -> {
 if (age <= 30) return "Young";
 else if (age <= 50) return "Middle-aged";
 else return "Senior";
 }).collect(Collectors.toList());

 List<String> incomeGroups = incomes.stream().map(income -> {
 if (income < 40000) return "Low";
 else if (income <= 70000) return "Medium";
 else return "High";
 }).collect(Collectors.toList());

 // Step 3: Print a summary of the dataset
 System.out.println("Sample of the dataset:");
 for (int i = 0; i < 5; i++) {
 System.out.printf("Age: %d, Income: %d, Gender: %s, Spend Score: %d, City: %s, Age Group: %s, Income Group: %s\n",
 ages.get(i), incomes.get(i), genders.get(i), spendScores.get(i), cities.get(i), ageGroups.get(i), incomeGroups.get(i));
 }

 // Step 4: Perform a correlation-like analysis (simplified for Java)
 double ageIncomeCorrelation = calculateCorrelation(ages, incomes);
 double ageSpendScoreCorrelation = calculateCorrelation(ages, spendScores);
 double incomeSpendScoreCorrelation = calculateCorrelation(incomes, spendScores);

 System.out.println("\nCorrelation Analysis:");
 System.out.printf("Age-Income Correlation: %.2f\n", ageIncomeCorrelation);
 System.out.printf("Age-Spend Score Correlation: %.2f\n", ageSpendScoreCorrelation);
 System.out.printf("Income-Spend Score Correlation: %.2f\n", incomeSpendScoreCorrelation);

 // Visualizations would typically require a separate library for Java, such as JFreeChart or JavaFX.
 System.out.println("\nVisualizations are not implemented in this text-based example.");
 }

 // Helper method to calculate a simplified correlation
 private static double calculateCorrelation(List<Integer> x, List<Integer> y) {
 if (x.size() != y.size()) throw new IllegalArgumentException("Lists must have the same size");

 int n = x.size();
 double meanX = x.stream().mapToDouble(a -> a).average().orElse(0);
 double meanY = y.stream().mapToDouble(a -> a).average().orElse(0);

 double covariance = 0;
 double varianceX = 0;
 double varianceY = 0;

 for (int i = 0; i < n; i++) {
 double deltaX = x.get(i) - meanX;
 double deltaY = y.get(i) - meanY;
 covariance += deltaX * deltaY;
 varianceX += deltaX * deltaX;
 varianceY += deltaY * deltaY;
 }

 return covariance / Math.sqrt(varianceX * varianceY);
 }
}
Although the Java code provides functionality for dataset creation and simple analyses, further development would require additional libraries for visualization.
While Canvas supports Python, integrating external datasets can be challenging due to sandbox restrictions. However, generating synthetic data within Canvas or importing subsets of datasets can mitigate these issues. Additionally, Python code can be ported to other languages, though execution outside Python is not supported within Canvas.
Overall, Canvas offers a user-friendly and collaborative environment. Improving its ability to integrate external data and supporting more programming languages would make it even more versatile and useful.
Coding with ChatGPT Canvas combines AI assistance with a collaborative workspace, making it a practical tool for developers. Whether you’re debugging code, analyzing data, or brainstorming ideas, Canvas simplifies the process and boosts productivity.
Have you tried coding with Canvas? Share your experiences and let me know how it worked for you in the comment section below.
Stay tuned to Analytics Vidhya Blog for more such updates!
ChatGPT Canvas is a feature that allows users to edit, collaborate, and refine long documents or code directly alongside their conversations with ChatGPT.
OpenAI offers free access to some features of ChatGPT, but advanced features and models often require a paid subscription.
Yes, OpenAI Canvas allows users to edit and refine code directly alongside AI-powered suggestions.
Hi, I am Janvi, a passionate data science enthusiast currently working at Analytics Vidhya. My journey into the world of data began with a deep curiosity about how we can extract meaningful insights from complex datasets.
GPT-4 vs. Llama 3.1 – Which Model is Better?
Llama-3.1-Storm-8B: The 8B LLM Powerhouse Surpa...
A Comprehensive Guide to Building Agentic RAG S...
Top 10 Machine Learning Algorithms in 2026
45 Questions to Test a Data Scientist on Basics...
90+ Python Interview Questions and Answers (202...
8 Easy Ways to Access ChatGPT for Free
Prompt Engineering: Definition, Examples, Tips ...
What is LangChain?
What is Retrieval-Augmented Generation (RAG)?
Edit
Resend OTP
Resend OTP in 45s