 |
VOOZH | about |
|
VOOZH | about |
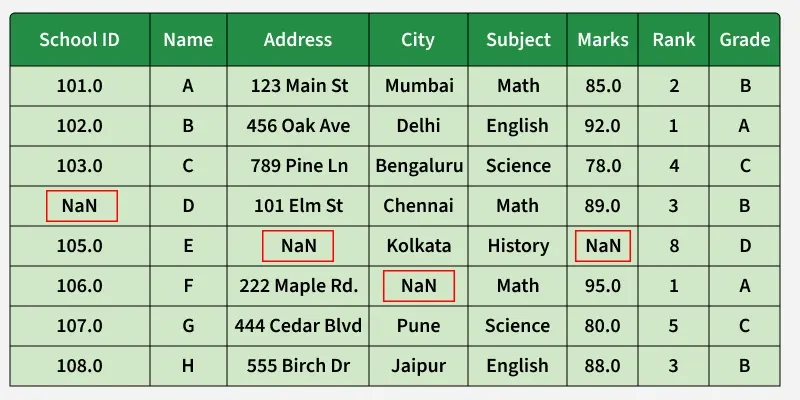
Missing values appear when some entries in a dataset are left blank, marked as NaN, None or special strings like "Unknown". If not handled properly, they can reduce accuracy, create bias and break algorithms that require complete data.
Data can be missing from a dataset for several reasons and understanding the cause is important for selecting the most effective way to handle it. Common reasons for missing data include:
By identifying the reason behind the missing data, we can better assess its impact whether it's causing bias or affecting the analysis and select the proper handling method such as imputation or removal.
Detecting and managing missing data is important for data analysis. Let's see some useful functions for detecting, removing and replacing null values in Pandas DataFrame.
Functions | Descriptions |
|---|---|
.isnull() | Detect missing values |
.notnull() | Detect non-missing values |
.info() | Summary with missing counts |
.isna() | Same as isnull(). |
| dropna() | Remove missing rows/columns |
| fillna() | Fill missing values |
| replace() | Replace specific values |
| drop_duplicates() | Remove duplicate rows |
| unique() | Get unique values in a Series/DataFrame |
For more detail refer to Working with Missing Data in Pandas
Missing values can appear in different forms, so using a consistent and well-documented format is important for clean data handling.
Common representations include:
Depending on the nature of the data and the missingness, several strategies can help maintain the integrity of our analysis. Let's see some of the most effective methods to handle missing values.
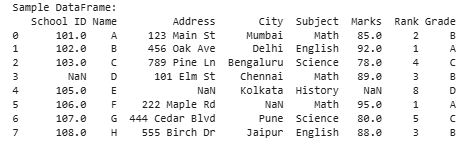
Here we will be using Pandas and Numpy libraries.
Output:
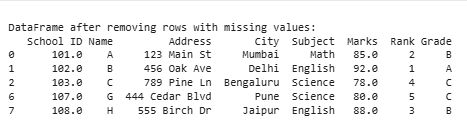
Removing rows with missing entries is the simplest way to handle missing data. It keeps the dataset clean but may reduce sample size and introduce bias if missingness is not random.
In this example, we are removing rows with missing values from the original DataFrame (df) using the dropna() method and then displaying the cleaned DataFrame (df_cleaned).
Output:
Pros: simple, quick, results in a fully complete dataset
Cons: loss of data, possible bias
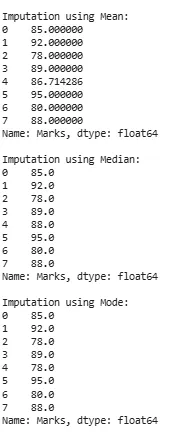
Imputation replaces missing values with estimated values to preserve the dataset’s size. However, the filled values may not always represent the true data.
1. Mean, Median and Mode Imputation: This method involves replacing missing values with the mean, median or mode of the relevant variable. It's a simple approach but it doesn't account for the relationships between variables.
Output:
Explanation: In this example, we are explaining the imputation techniques for handling missing values in the 'Marks' column of the DataFrame (df). It calculates and fills missing values with the mean, median and mode of the existing values in that column and then prints the results for observation.
Pros: easy, fast, suitable for numeric variables
Cons: may distort the true distribution of the data
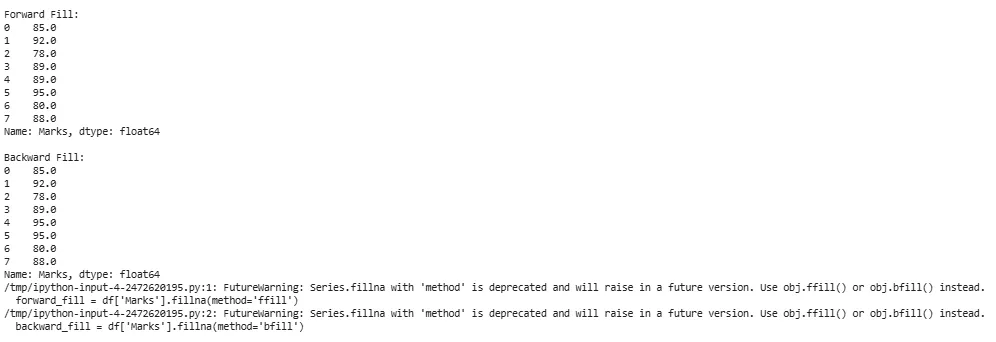
2. Forward and Backward Fill : These methods fill missing values using the closest available values in the column. They are useful for ordered or time-series data.
Output:
Explanation:The method parameter in fillna() allows to specify the filling strategy.
Pros: preserves order and patterns in data
Cons: may be inaccurate when gaps are large or values differ significantly
Note:
- Forward fill uses the last valid observation to fill missing values.
- Backward fill uses the next valid observation to fill missing values.
Interpolation estimates missing values by using the trend or pattern of surrounding data points. It is more informative than simple imputation.
Output:
Explanation: The interpolate() method in pandas are divided into Linear and Quadratic.
Pros: captures trends, preserves relationships
Cons: assumes a pattern (linear, quadratic), may be complex
Note:
- Linear interpolation assumes a straight line between two adjacent non-missing values.
- Quadratic interpolation assumes a quadratic curve that passes through three adjacent non-missing values.
Handling missing values effectively is important to ensure the accuracy and reliability of our findings.