 |
VOOZH | about |
|
VOOZH | about |
Standard Deviation is an absolute measure of dispersion, which means it cannot be used to compare the variability of datasets expressed in different units. To make such comparisons possible, relative measures are used, the most common being the Coefficient of Variation.
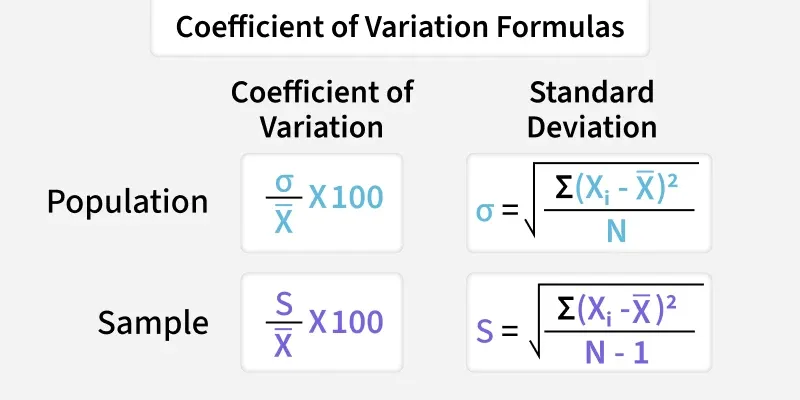
The Coefficient of Variation, introduced by Karl Pearson is a relative measure that expresses the ratio of Standard Deviation to the Mean. It is useful for comparing datasets in terms of stability, homogeneity or consistency and for analyzing variability.
Coefficient of Variation is expressed as percentage and can be determined using the following:
Where,
Let's see few examples to understand Coefficient of Variation better.
Series X: [11.5, 46, 80.5]. We need to find the Coefficient of Variance of series X.
C.V. of Series X = 55.43%.
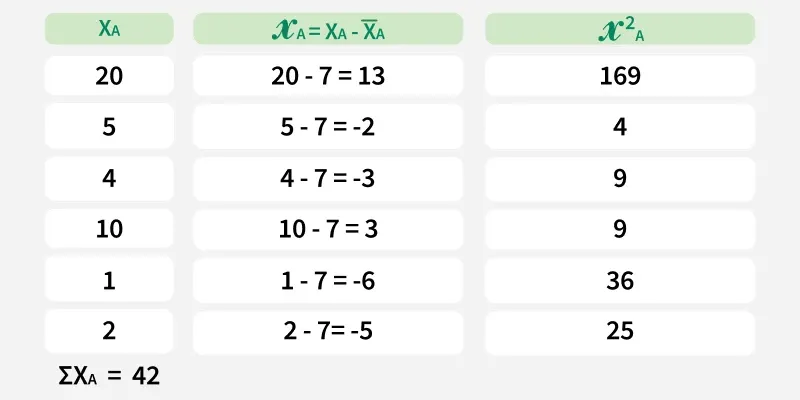
The number of points scored by two teams in a hockey match is given below. With the help of Coefficient of Variation, we need to determine which team is more consistent.
Coefficient of Variation (Team A):
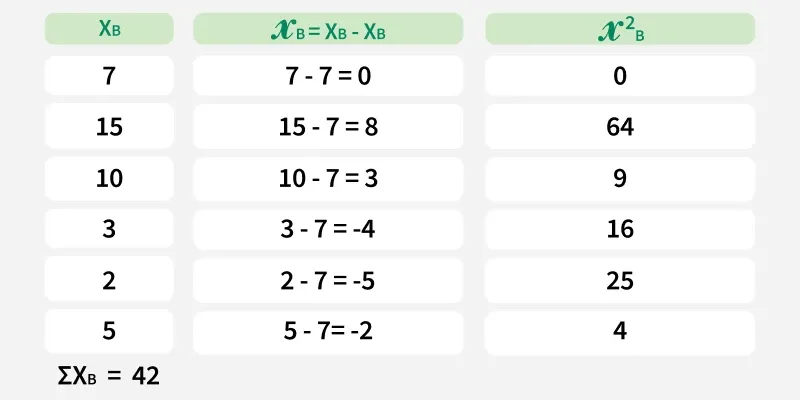
Coefficient of Variation (Team B):
Coefficient of Variation of Team B is less, i.e., 63.24% so Team B is more consistent.
Ways to interpret Coefficient of Variation (C.V.):
Python implementation of coefficient of variation using Numpy:
Output:
Coefficient of Variation for data: 25.11%
In fields like finance or biology, a slightly higher C.V. might still be acceptable while in engineering or manufacturing, a lower CV is preferred for reliability.
Here are some of the key applications of Coefficient of Variance.
Comparison table among Standard Deviation, Variance and Coefficient of Variance.
Measure | Variance | Standard Deviation | Coefficient of Variation |
|---|---|---|---|
Definition | Average of squared deviations from the mean | Square root of variance, average deviation from mean | Ratio of SD to mean, expressed as a percentage |
Units | Squared units of data | Same units as data | Unit free |
Use Case | Measures overall spread of data | Shows absolute variability in data | Compares relative variability across datasets |
Limitation | Hard to interpret due to squared units | Not suitable for comparing datasets with different scales | Misleading if mean is close to zero |