 |
VOOZH | about |
|
VOOZH | about |
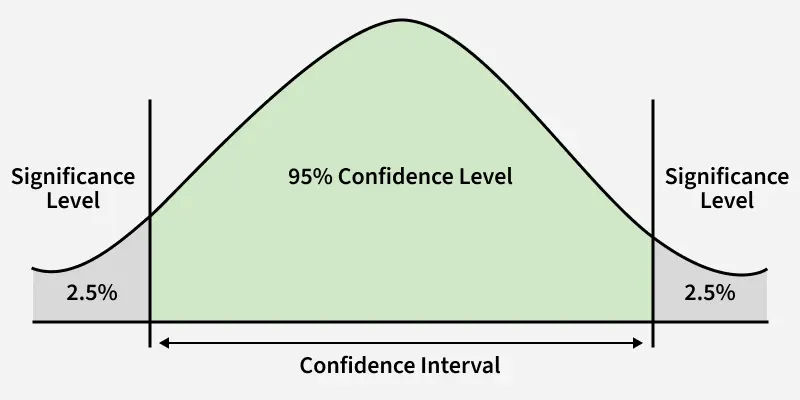
A Confidence Interval (CI) is a range of values that contains the true value of something we are trying to measure like the average height of students or average income of a population.
Instead of saying: “The average height is 165 cm.”
We can say: “We are 95% confident the average height is between 160 cm and 170 cm.”
Let's say we take a sample of 50 students and calculate a 95% confidence interval for their average height which turns out to be 160–170 cm. This means If we repeatedly take similar samples 95% of those intervals would contain the true average height of all students in the population.
Confidence level tells us how sure we are that the true value is within a calculated range. If we have to repeat the sampling process many times we expect that a certain percentage of those intervals will include the true value.
Confidence Level | Meaning |
|---|---|
90% | 90 out of 100 intervals will include the true value |
95% | 95 out of 100 intervals will include the true value (most commonly used) |
99% | 99 out of 100 intervals will include the true value (more conservative) |
Where is the significance level (commonly 0.05 for 95% CI).
To calculate a confidence interval follow these simple 4 steps:
Define the population parameter you want to estimate e.g., mean height of students. Choose the right statistic such as the sample mean.
In this step we select the confidence level some common choices are 90%, 95% or 99%. It represents how sure we are about our estimate.
To find the Margin of Error, you use the formula:
Margin of Error = Critical Value × Standard Error
Combine these to get your Margin of Error the amount you add/subtract from your estimate to create a range.
To find a Confidence Interval, we use this formula:
Confidence Interval = Point Estimate ± Margin of Error
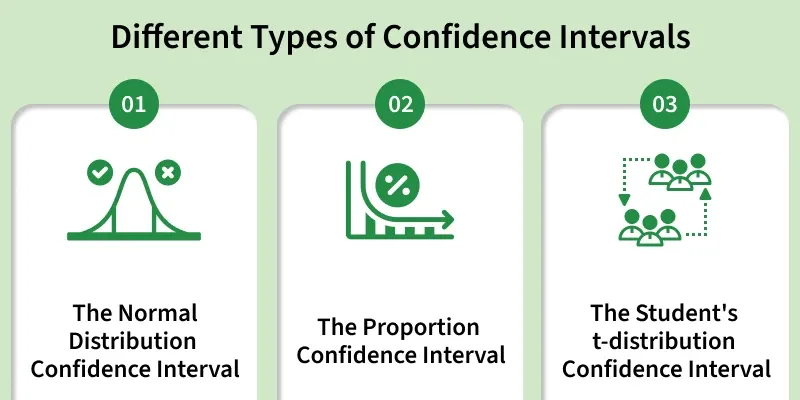
Some of the common types of Confidence Intervals are:
When we want to find the mean of a population based on a sample we use this method.
This type is used when estimating population proportions like the percentage of people who like a product. Here we use the sample proportion, the standard error and the critical Z-value to calculate the interval. It gives us the idea where the real value could fall based on sample data.
If your data isn’t normally distributed (doesn’t follow a bell curve), use bootstrap methods:
This gives a good estimate even if the data is skewed or irregular.
To calculate a confidence interval you need two key statistics:
Once you have these you can calculate the confidence interval either using t-distribution or z-distribution depend on the sample size whether the population standard deviation is known.
Used when:
Example:
Sample size = 10
Mean weight = 240 kg
Std deviation = 25 kg
Confidence Level = 95%
Step-by-Step Process:
| (df)/(α) | 0.1 | 0.05 | 0.025 | . . |
|---|---|---|---|---|
∞ | 1.282 | 1.645 | 1.960 | . . |
1 | 3.078 | 6.314 | 12.706 | . . |
2 | 1.886 | 2.920 | 4.303 | . . |
: | : | : | : | . . |
8 | 1.397 | 1.860 | 2.306 | . . |
9 | 1.383 | 1.833 | 2.262 | . . |
Therefore we are 95% confident that the true mean weight of UFC fighters is between 222.117 kg and 257.883 kg.
This can be calculated using Python’s scipy and math library to find the t-value and perform the necessary calculations. The stats module provides various statistical functions, probability distributions, and statistical tests.
Output:
Confidence Interval: (222.1160773511857, 257.8839226488143)
Used when:
Consider the following example. A random sample of 50 adult females was taken and their RBC count is measured. The sample mean is 4.63 and the standard deviation of RBC count is 0.54. Construct a 95% confidence interval estimate for the true mean RBC count in adult females.
Step-by-Step Process:
Using the values: some common values in the table given below:
| Confidence Interval | z-value |
|---|---|
90% | 1.645 |
95% | 1.960 |
99% | 2.576 |
The confidence interval becomes: (4.480,4.780)
Therefore we are 95% confident that the true mean RBC count for adult females is between 4.480 and 4.780.
Now let's do the implementation of it using Python. But before its implementation we should have some basic knowledge about numpy and scipy.
Output:
Confidence Interval: (4.480, 4.780)
Some Key Takeaways from Confidence Interval are: