 |
VOOZH | about |
|
VOOZH | about |
Ordinary Least Squares (OLS) is a widely used statistical method for estimating the parameters of a linear regression model. It minimizes the sum of squared residuals between observed and predicted values. In this article we will learn how to implement Ordinary Least Squares (OLS) regression using Python's statsmodels module.
Alinear regression model establishes the relationship between a dependent variable (y) and one or more independent variables (x):
Where:
The OLS method minimizes the total sum of squares of residuals (S) defined as:
To find the optimal values of b0 and b1 partial derivatives of S with respect to each coefficient are taken and set to zero.
Before starting, we need to import necessary libraries like pandas , numpy and matplotlib.
We load the dataset from a CSV file using pandas. You can download dataset from here. The dataset contains two columns:
x: Independent variable (predictor).y: Dependent variable (response).In linear regression the equation includes an intercept term (b0). To include this term in the model we use the add_constant() function from statsmodels.
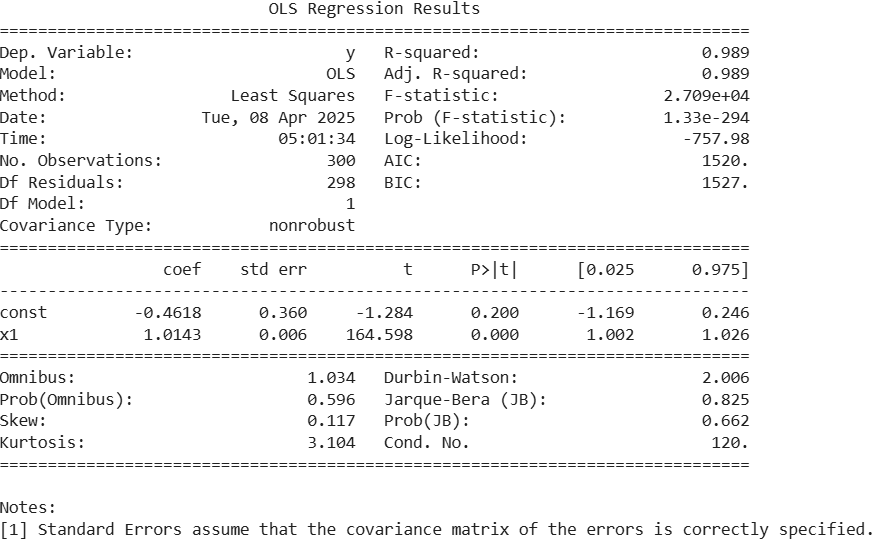
Now we fit the OLS regression model using the OLS() function. This function takes the dependent variable (y) and the independent variable (x) as inputs.
Output :
x1 is highly significant (p < 0.001) and has a strong positive effect on the target variable.To better understand the relationship between x and y we plot the original data points and the fitted regression line.
Output:
The above plot shows a strong linear relationship between the independent variable (X) and the dependent variable (Y). Blue dots represent the actual data points which are closely aligned with the red regression line indicating a good model fit.