 |
VOOZH | about |
|
VOOZH | about |
Horizontal Lines on Chart.js are a useful way to enhance data visualization by providing reference lines at specific values across the chart. These lines can help highlight thresholds, targets, or significant data points, making it easier for users to interpret the data. In this article, we will explore two different approaches to Draw horizontal lines on Chart.js.
<script src="https://cdnjs.cloudflare.com/ajax/libs/Chart.js/3.7.0/chart.min.js"></script>These are the following approaches:
Table of Content
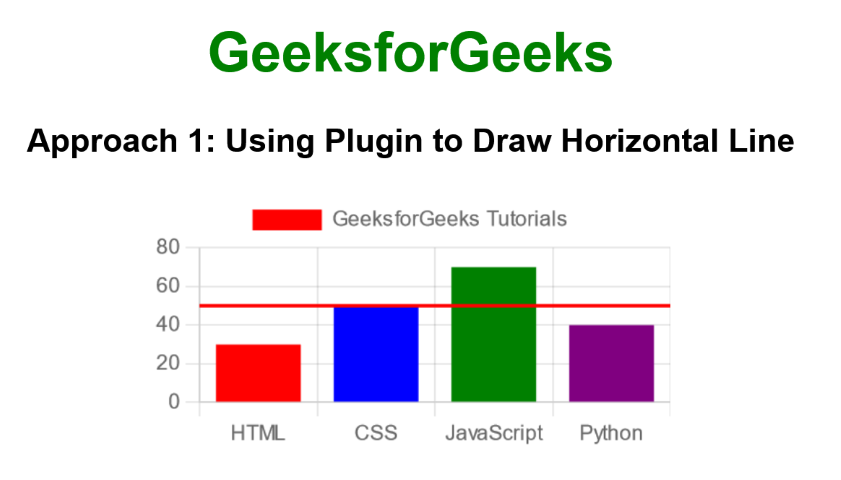
lugin To draw a Horizontal LineIn this approach, we are using a custom Chart.js plugin to draw a horizontal line at a specific y-value on the chart. The plugin, defined as horizontalLinePlugin, uses the afterDraw hook to access the chart's canvas context and draw the line across the chart area.
Example: The below example uses plugin to Draw a Horizontal Line.
Output:
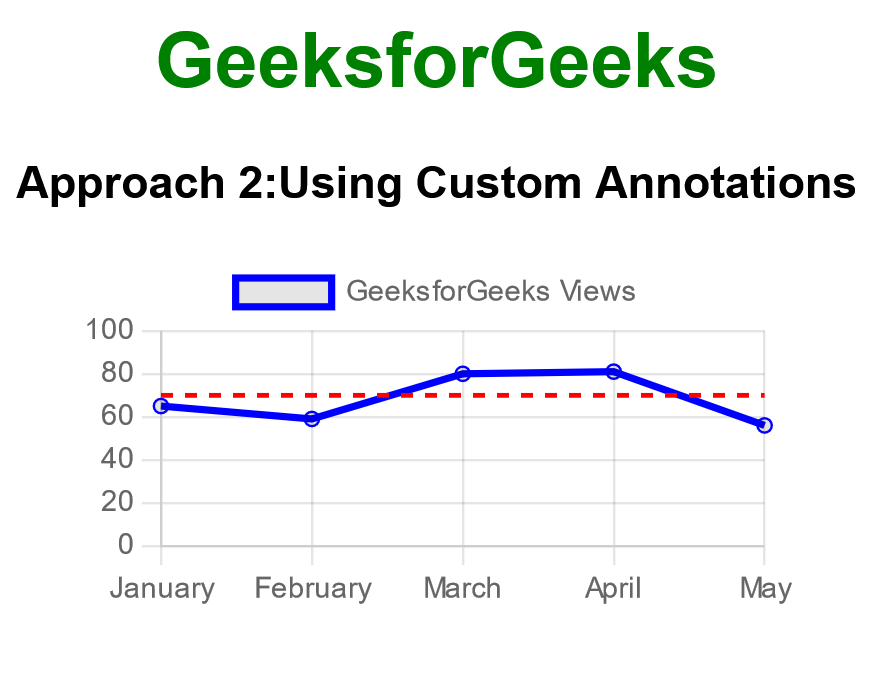
In this approach, we are using the animation.onComplete callback within Chart.js to draw a horizontal line after the chart animation completes. This method involves accessing the chart's canvas context and drawing the line manually at a specific y-value, using the setLineDash method to create a dashed effect.
Example: The below example uses Custom Annotations to Draw a Horizontal Line.
Output