 |
VOOZH | about |
|
VOOZH | about |
The Keynesian Theory states that the equilibrium situation is usually expressed in terms of Aggregate Demand (AD) and Aggregate Supply (AS). When aggregate demand for products and services over a given period of time equals aggregate supply, an economy is in equilibrium.
So, equilibrium is attained when:
AD = AS
Now, we know that,
AD = C + I,
and AS = C + S
Therefore,
C + S = C + I
i.e., S = I
Therefore, according to Keynes, the two approaches to determine the equilibrium level of income and employment of an economy are Aggregate Demand-Aggregate Supply Approach (AD-AS Approach)and Saving-Investment Approach (S-I Approach).
However, to determine the equilibrium output, there are certain assumptions that needs to be kept in mind.
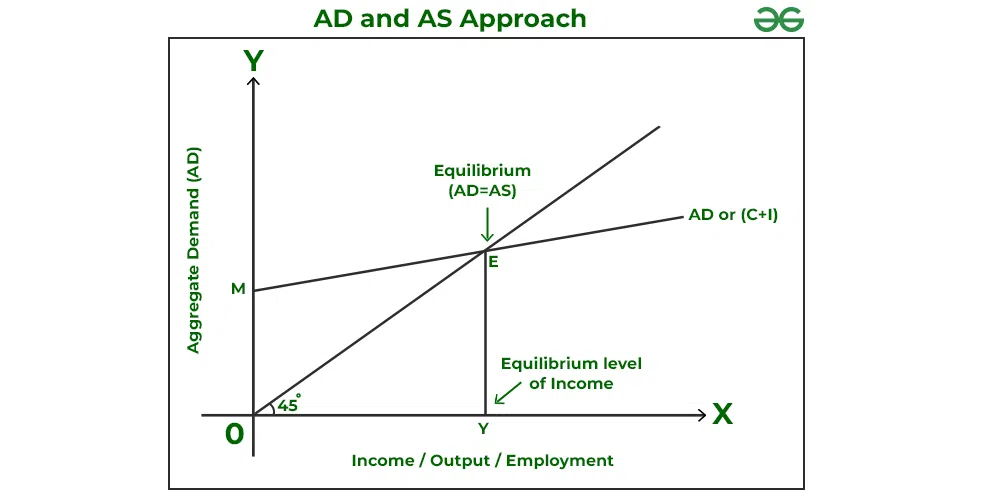
The Keynesian theory states that when aggregate demand as shown by the C+I curve is equal to the total output (Aggregate Supply or AS), the equilibrium level of income in an economy is established.
There are two parts to the aggregate demand:
So, in the income determination analysis, the AD curve is represented by the C+I curve.
The overall output of goods and services from the national income is known as the aggregate supply. A 45° line is used to represent it. The AS curve is represented by the (C+S) curve because the money received is either spent or saved.
The AD or (C+ I) curve in the above graph shows the desired expenditure level by consumers and businesses at each level of income. At point E where the (C+ I) curve intersects the 45° line, the economy is in equilibrium.
The Saving-Investment Approach states that when the planned saving (S) is equal to the planned investment (I), the equilibrium level of income in an economy is established.
Example:
The Investment curve in the above graph shows the autonomous investment made; therefore, it is parallel to the X-axis. The Saving Curve S slopes upward, which means that saving increases with an increase in income. At point E where the investment curve intersects the saving curve, the economy is in equilibrium.