VOOZH
about
URL: https://www.geeksforgeeks.org/tag/python-pygal-chart/
⇱ Python pygal-chart Archives - GeeksforGeeks
👁 geeksforgeeks
Courses
Tutorials
Interview Prep
DSA
Practice Problems
C
C++
Java
Python
JavaScript
Data Science
Machine Learning
Courses
Linux
DevOps
Similar Topics
Web Technologies
32.1K+ articles
DSA
20.4K+ articles
Python
19.6K+ articles
Experiences
15.8K+ articles
Interview Experiences
14.5K+ articles
School Learning
11.1K+ articles
JavaScript
9.9K+ articles
Python Django
582+ articles
Data Visualization
109+ articles
Python-pygal
32+ articles
Data visualization With Pygal
Last Updated: 23 July 2025
Pygal is an open-source Python library designed for creating interactive SVG (Scalar Vector Graphics) charts. It is known for its simplicity and ability to produce high-qu...
read more
👁 article_image
Picked
Python pygal-chart
Data Visualization
AI-ML-DS
AI-ML-DS With Python
Embed pygal charts in Django Application
Last Updated: 23 July 2025
Suppose we are developing a web application using the Django framework and we have some data and want to visualize it on the webpage We can embed it in Django templates an...
read more
👁 article_image
Python
Python Django
Python pygal-chart
Pygal Tutorial
Last Updated: 23 July 2025
Pygal is a Python library and It is an open-source that is used for creating visual and interactive charts. This library is based on SVG technology, which ensures that the...
read more
👁 article_image
Python
Python-pygal
Python pygal-chart
Solid Gauge Chart in Pygal
Last Updated: 10 July 2020
Pygal is a Python module that is mainly used to build SVG (Scalar Vector Graphics) graphs and charts. SVG is a vector-based graphics in the XML format that can be edited i...
read more
👁 article_image
Python
Data Visualization
Python-pygal
Python pygal-chart
Stacked Bar chart in pygal
Last Updated: 10 July 2020
Pygal is a Python module that is mainly used to build SVG (Scalar Vector Graphics) graphs and charts. SVG is a vector-based graphics in the XML format that can be edited i...
read more
👁 article_image
Python
Data Visualization
Python-pygal
Python pygal-chart
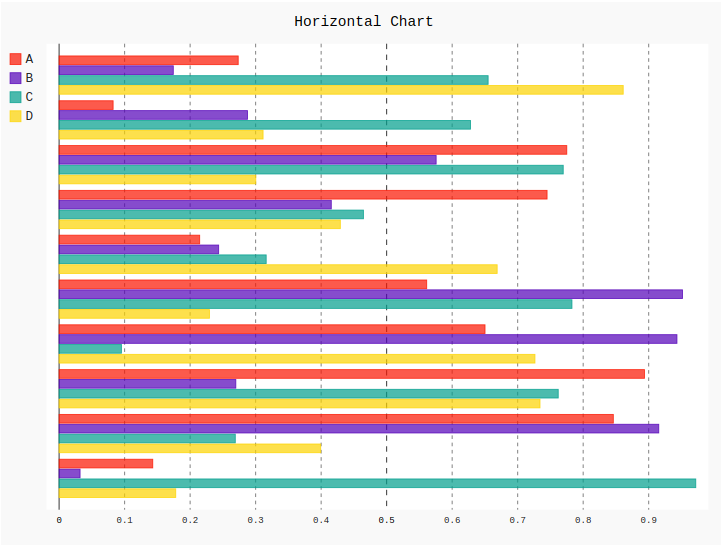
Bar Chart in Pygal
Last Updated: 20 June 2022
Pygal is a Python module that is mainly used to build SVG (Scalar Vector Graphics) graphs and charts. SVG is a vector-based graphics in the XML format that can be edited i...
read more
👁 article_image
Python
Data Visualization
Python-pygal
Python pygal-chart
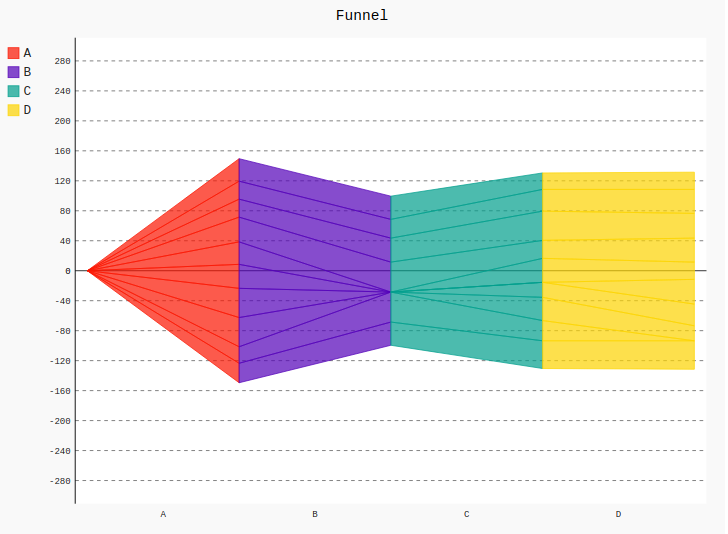
Funnel Chart in Pygal
Last Updated: 28 July 2020
Pygal is a Python module that is mainly used to build SVG (Scalar Vector Graphics) graphs and charts. SVG is a vector-based graphics in the XML format that can be edited i...
read more
👁 article_image
Python
Data Visualization
Python-pygal
Python pygal-chart
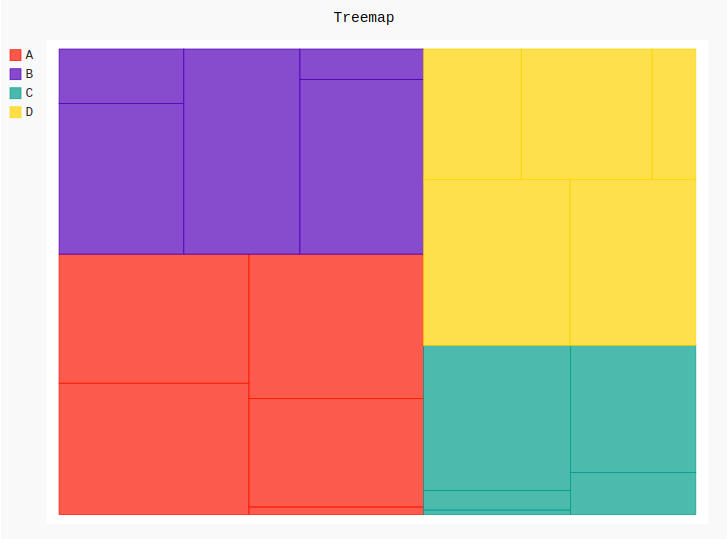
Treemap in Pygal
Last Updated: 28 July 2020
Pygal is a Python module that is mainly used to build SVG (Scalar Vector Graphics) graphs and charts. SVG is a vector-based graphics in the XML format that can be edited i...
read more
👁 article_image
Python
Data Visualization
Python-pygal
Python pygal-chart
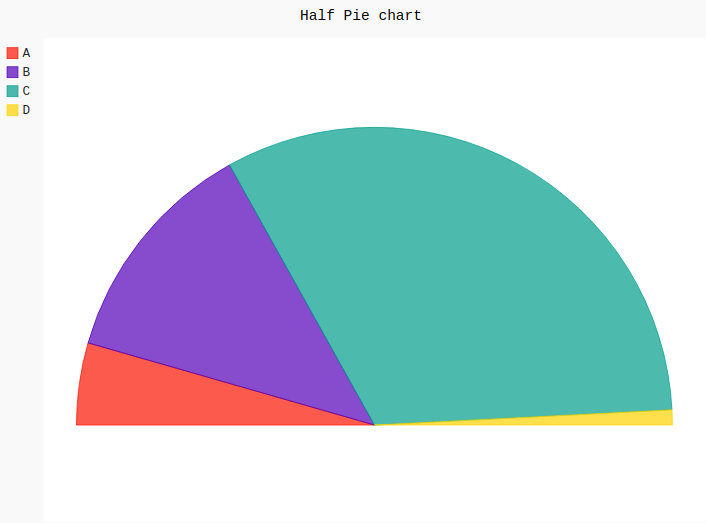
Half pie chart in Pygal
Last Updated: 28 July 2020
Pygal is a Python module that is mainly used to build SVG (Scalar Vector Graphics) graphs and charts. SVG is a vector-based graphics in the XML format that can be edited i...
read more
👁 article_image
Python
Data Visualization
Python-pygal
Python pygal-chart
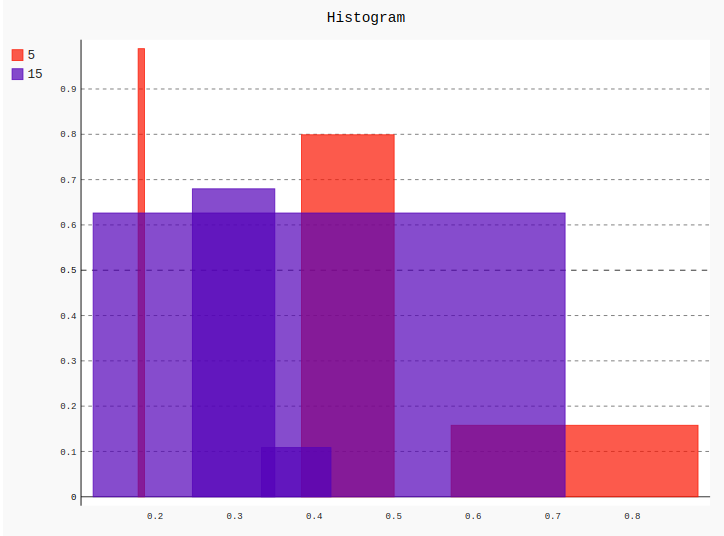
Histogram in Pygal
Last Updated: 28 July 2020
Pygal is a Python module that is mainly used to build SVG (Scalar Vector Graphics) graphs and charts. SVG is a vector-based graphics in the XML format that can be edited i...
read more
👁 article_image
Python
Data Visualization
Python-pygal
Python pygal-chart
Radar chart in pygal
Last Updated: 10 July 2020
Pygal is a Python module that is mainly used to build SVG (Scalar Vector Graphics) graphs and charts. SVG is a vector-based graphics in the XML format that can be edited i...
read more
👁 article_image
Python
Data Visualization
Python-pygal
Python pygal-chart
Gauge Chart in pygal
Last Updated: 03 July 2020
Pygal is a Python module that is mainly used to build SVG (Scalar Vector Graphics) graphs and charts. SVG is a vector-based graphics in the XML format that can be edited i...
read more
👁 article_image
Python
Data Visualization
Python-pygal
Python pygal-chart
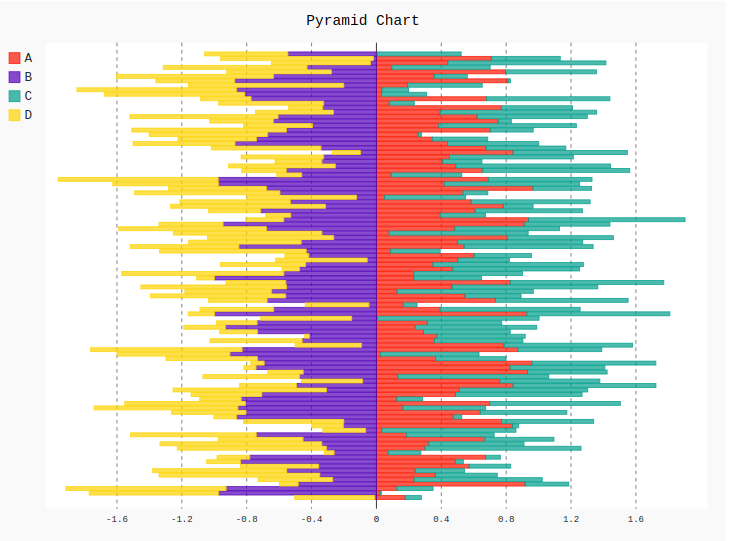
Pyramid chart in pygal
Last Updated: 03 July 2020
Pygal is a Python module that is mainly used to build SVG (Scalar Vector Graphics) graphs and charts. SVG is a vector-based graphics in the XML format that can be edited i...
read more
👁 article_image
Python
Data Visualization
Python-pygal
Python pygal-chart
