 |
VOOZH | about |
|
VOOZH | about |
Pygal is a Python module that is mainly used to build SVG (Scalar Vector Graphics) graphs and charts. SVG is a vector-based graphics in the XML format that can be edited in any editor. Pygal can create graphs with minimal lines of code that can be easy to understand and write.
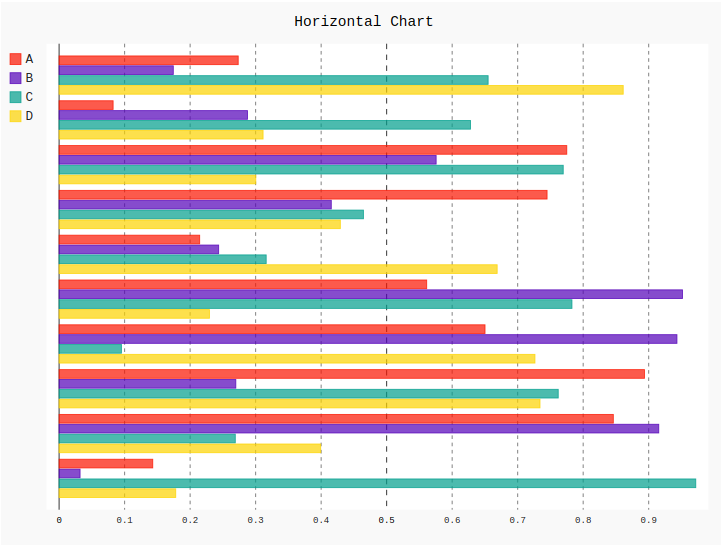
A bar chart or a graph is which present the data in the categorical form with rectangular bars with heights or lengths proportional to the values which represent in a graph. The bars can be plotted vertically or horizontally. A vertical bar chart is sometimes known as a column chart. One axis of the chart shows the specific categories being compared and the other axis represents a measured value.
line_chart = pygal.HorizontalBar()
line_chart = pygal.Bar()