 |
VOOZH | about |
|
VOOZH | about |
Pygal is a Python module that is mainly used to build SVG (Scalar Vector Graphics) graphs and charts. SVG is a vector-based graphics in the XML format that can be edited in any editor. Pygal can create graphs with minimal lines of code that can be easy to understand.
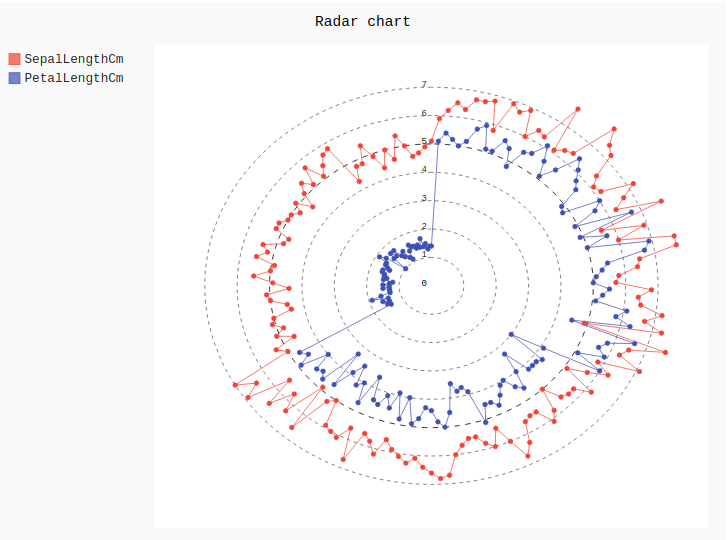
The radar chart is a chart or plot that consists of a sequence of equiangular spokes, called radii, with each spoke representing one of the variables. A radar chart is basically a graphical method of displaying data in the form of a two-dimensional chart of three or more quantitative variables that are represented on the axes starting from the same point. Radar charts are MORE helpful for small-to-moderate-sized multivariate data sets. It can be created using the Radar() method.
Syntax:
radar_chart = pygal.Radar()
Example 1:
Output:
👁 ImageExample 2:
Output:
👁 ImageExample 3: Using Iris Dataset