
If you are looking for a very easy-to-use performance monitoring tool for Linux, I highly recommend installing and using the Nmon command-line utility.
Nmon short for (Ngel’s Monitor), is a fully interactive Linux system performance monitoring command-line utility that was originally developed by IBM for the AIX systems and later ported to the Linux platform.
The important benefit of the nmon tool is that it allows you to monitor the performance of your Linux system aspects such as CPU utilization, memory usage, disk space, network utilization, top processes, virtual machine stats, file systems, resources, power micro-partition and more, in a single, concise view.
In addition to monitoring your Linux system interactively, nmon can also be used in batch mode to gather and save performance data for later analysis.
A very nice thing I really like about this tool is the fact that it is fully interactive and helps the Linux user or the system administrator with the necessary command to get the most out of it.
Installing Nmon Monitoring Tool in Linux
If you are using a Debian/Ubuntu-based Linux distribution you can easily install the Nmon command-line utility by grabbing it from the default repositories.
To install, Open a new terminal (CTRL+ALT+T) and use the following command.
$ sudo apt-get install nmon
Are you a Fedora user? To install it on your machine open a new terminal and run the following command.
# dnf install nmon
On RHEL-based distributions such as Rocky Linux and AlmaLinux, users can install it by installing the EPEL repository as shown:
------------- On RHEL, Rocky & AlmaLinux 9 -------------
# dnf install https://dl.fedoraproject.org/pub/epel/epel-release-latest-9.noarch.rpm
# yum install nmon

------------- On RHEL, Rocky & AlmaLinux 8 -------------
# dnf install https://dl.fedoraproject.org/pub/epel/epel-release-latest-8.noarch.rpm
# yum install nmon
On other Linux distributions, you can install nmon via the default package manager as shown.
$ sudo emerge -a sys-process/nmon [On Gentoo Linux]
$ sudo apk add nmon [On Alpine Linux]
$ sudo pacman -S nmon [On Arch Linux]
$ sudo zypper install nmon [On OpenSUSE]
How to use Nmon to Monitor Linux Performance
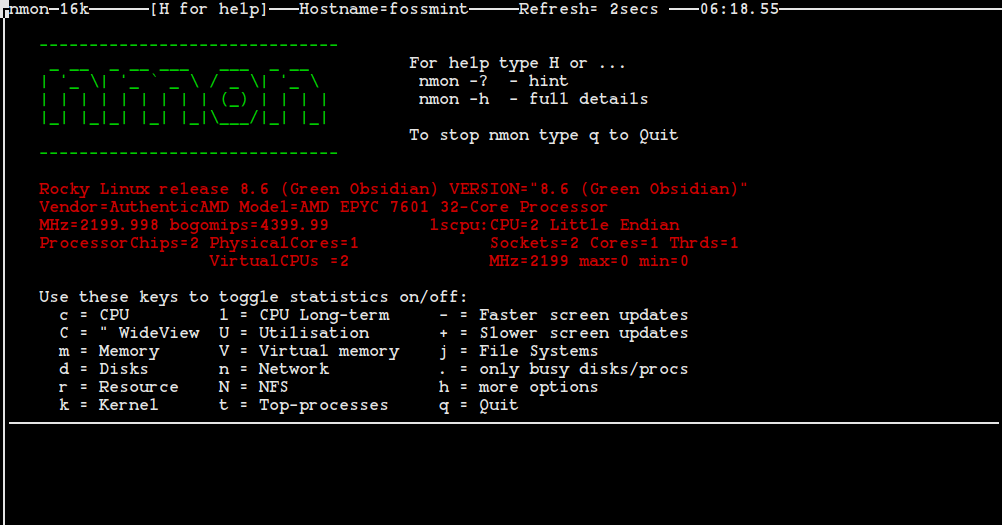
Once the installation of Nmon has been finished and you launch it from the terminal by typing the ‘nmon‘ command you will be presented with the following output.
# nmon
As you guys can see from the above screenshot, the nmon command-line utility runs completely in interactive mode and it presents the user with the keys to toggle statistics.
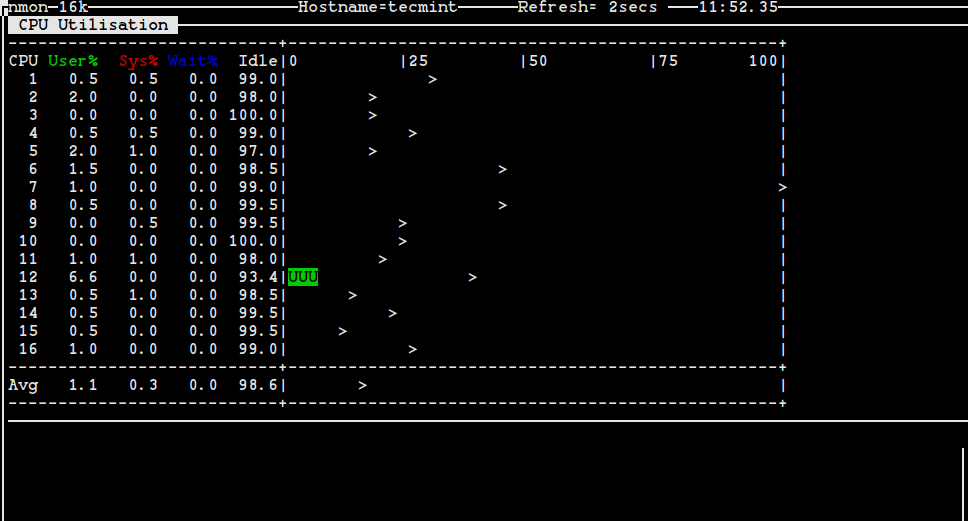
Monitor Linux CPU Utilisation
For example, if you would like to collect some statistics on CPU performance you should hit the ‘c‘ key on the keyboard of the system you are using. After hitting the ‘c‘ key on my keyboard I get a very nice output that gives me information on my CPU usage.
The following are the keys you can use with the utility to get information on other system resources present in your machine.
m– Memoryj– Filesystemsd– Disksn– NetworkV– Virtual Memoryr– ResourceN– NFSk– kernelt– Top-processes.– only busy disks/procsU– Utilisation
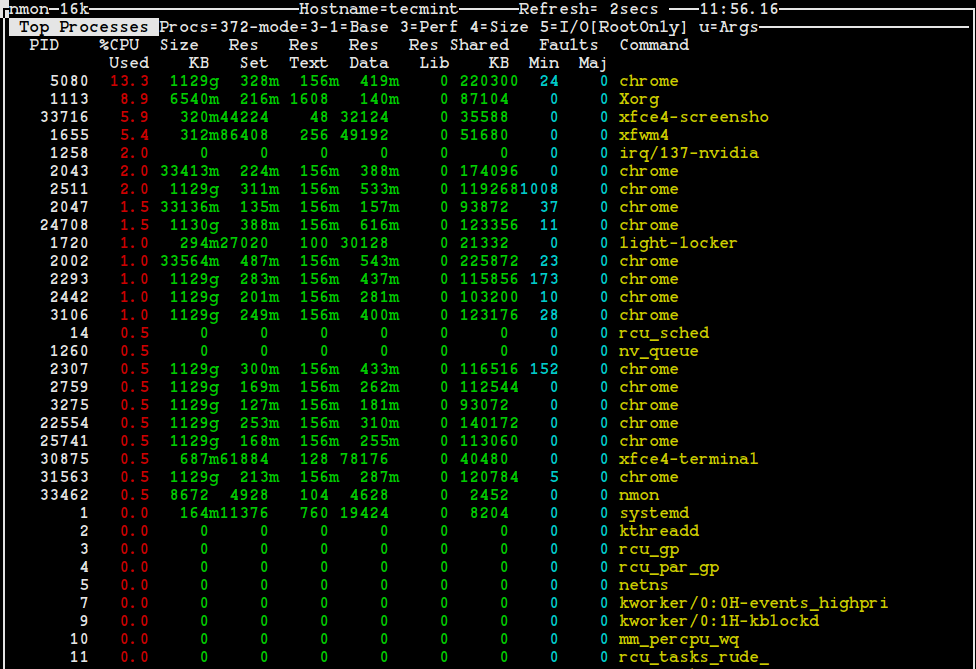
Monitor Linux Top Processes Statistics
To get stats on top processes that are running on your Linux system press the key ‘t‘ on your keyboard and wait for the information to show up.
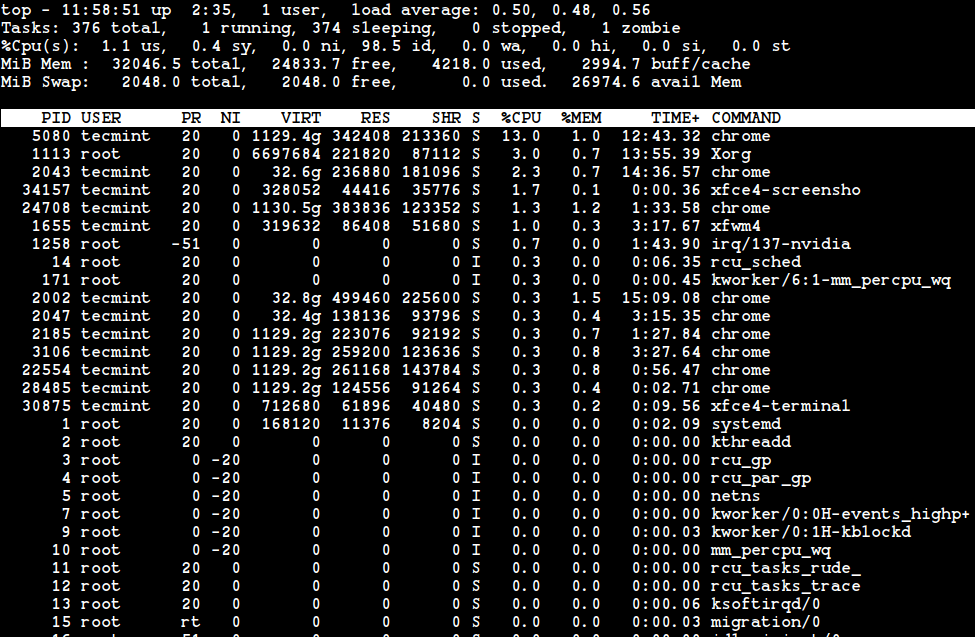
Those familiar with the top utility will understand and be able to interpret the above information very easily. If you are new to Linux system administering and have never used the top utility before, run the following command in your terminal and try to compare the produced output with the above one. Do they look similar, or is it the same output?
# top
It looks like I am running the top process monitoring utility when I use the key ‘t‘ with the Nmon tool to me.
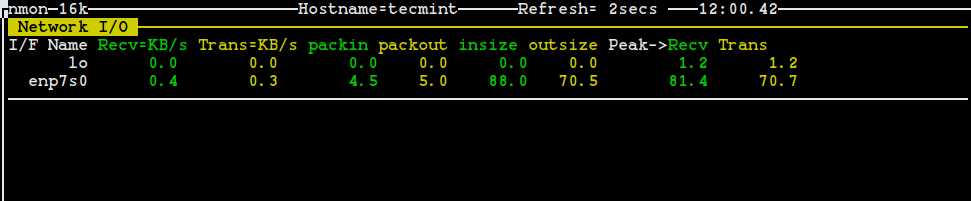
Monitor Linux Network Statistics
How about some network stats? Just press ‘n‘ on your keyboard.
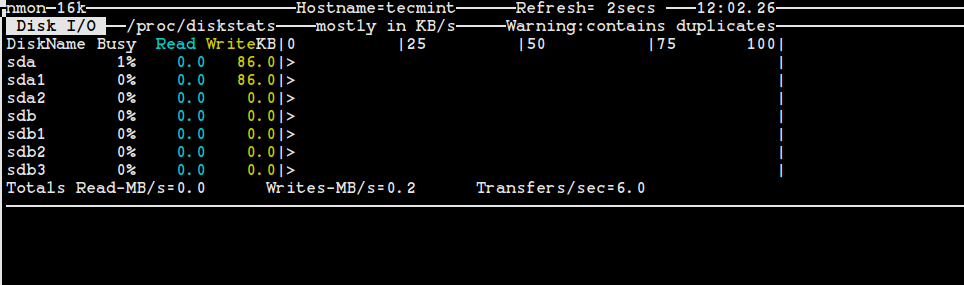
Monitor Linux Disk I/O Graphs
Use the ‘d‘ key to get information on disks.
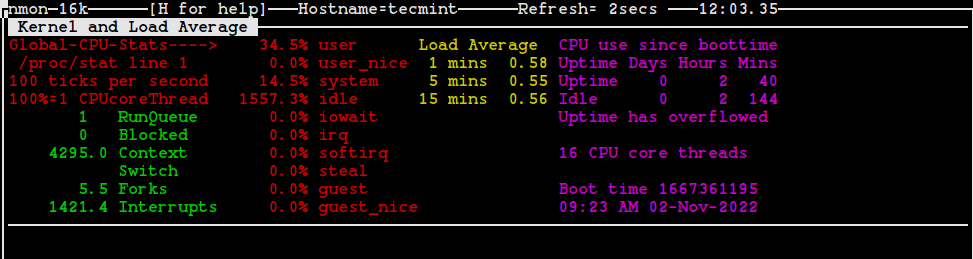
Check Linux Kernel Information
A very important key to use with this tool is ‘k‘, it is used to display some brief information on the kernel of your system.
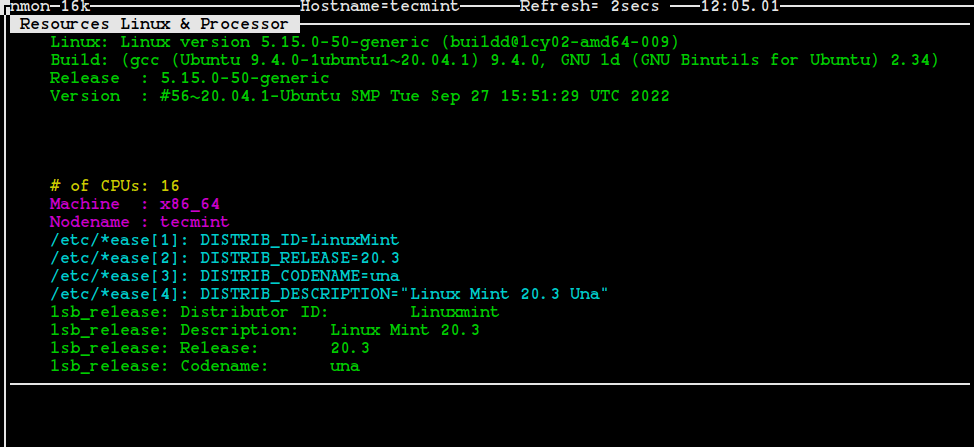
Check Linux System Information
A very useful key for me is the key ‘r‘ which is used to give information on different resources such as machine architecture, operating system version, Linux version, and CPU. You can get an idea of the importance of the key ‘r‘ by looking at the following screenshot.
Monitor Linux File System Statistics
To get stats on the file systems press ‘j‘ on your keyboard.
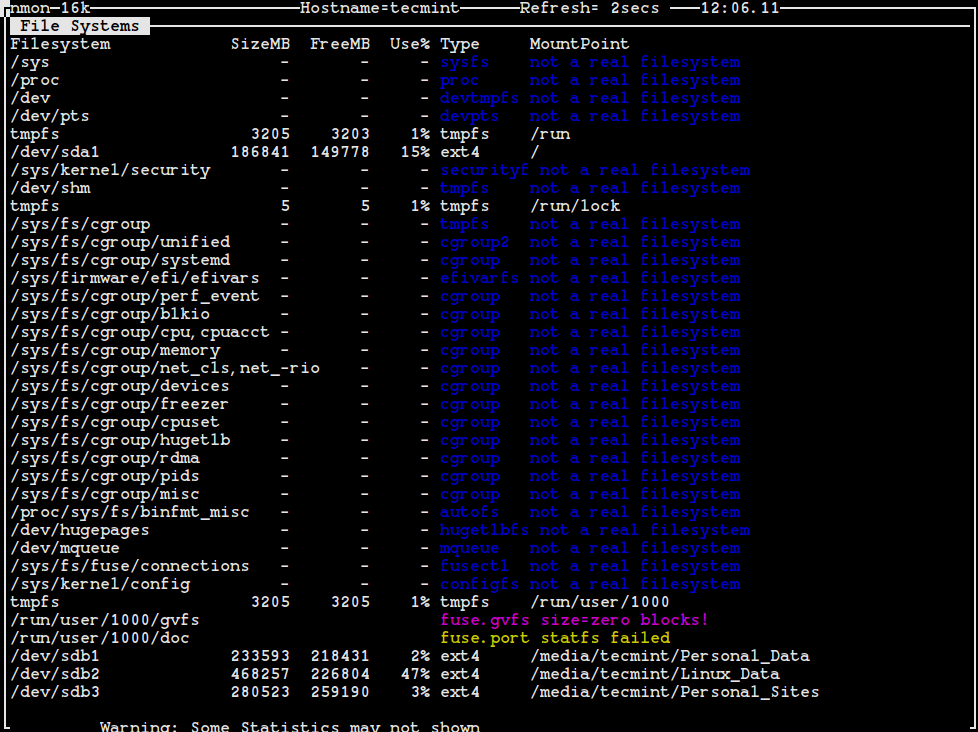
As you can see from the above screenshot, we get information on the size of the file system, used space, free space, type of file system, and the mount point.
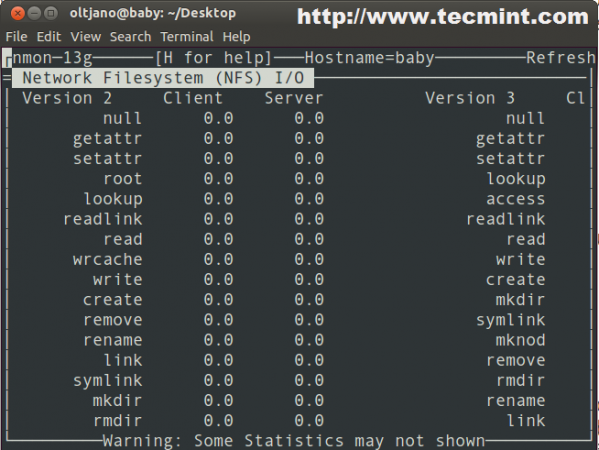
Check NFS Data
The key ‘N‘ can help to collect and display data on NFS.
So far it has been very easy to work with the Nmon utility. There are many other things you need to know about the utility and one of them is the fact that you can use it in data capture mode.
If you don’t like the data to be displayed on the screen you can easily capture a small sample file with the following command.
# nmon -f -s13 -c 30
After running the above command you will get a file with the ‘.nmon‘ extension in the directory where you were while working with the tool. What is the ‘-f‘ option? The following is a simple and short explanation of the options used in the above command.
- The
-fmeans you want the data saved to a file and not displayed on the screen. - The
-s13means you want to capture data every 13 seconds. - The
-c 30means you want thirty data points or snapshots.
Conclusion
There are many tools that can do the job of the Nmon utility, but none of them is so easy to use and friendly to a Linux beginner. Unfortunately, the tool does not have as many features as other tools such as collectl and it can not provide in-depth stats to the user.
In the end, I can say it is a very nice utility for a Linux system administrator, especially for someone that is not familiar with command-line options and commands.
If this article helped you solve a problem, consider buying a coffee. It helps keep TecMint free, supports the authors, and keeps the project going.
Got Something to Say? Join the Discussion... Cancel reply