
Feature Overview
Datadog’s IDE plugins enable application developers to continuously improve the performance, reliability, and security of their code by bringing live production data—such as top resource-consuming methods, errors, and OSS vulnerabilities—directly into their IDEs. Analyze production logs, CI flaky tests, and call trees of executed code right from your IDE to reduce debugging times and confidently deliver better software.
See also
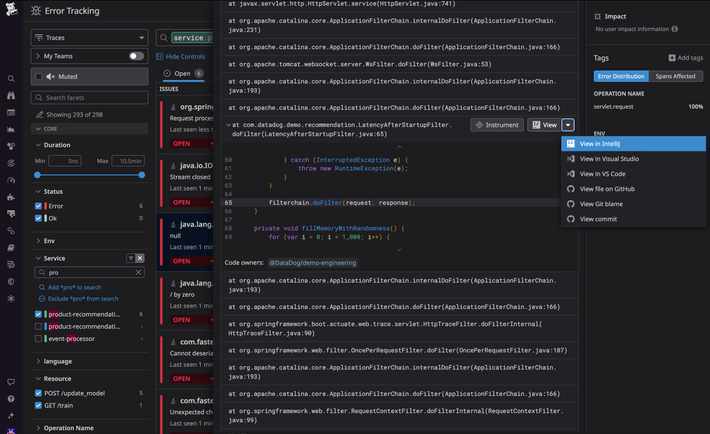
View documentationShip reliable and secure code using insights and recommendations on code quality
- View which errors affect your deployed apps with production data from Error Tracking
- Improve application security by finding and resolving vulnerabilities in your Open Source dependencies
- See test duration and flakes identified during CI directly in the IDE
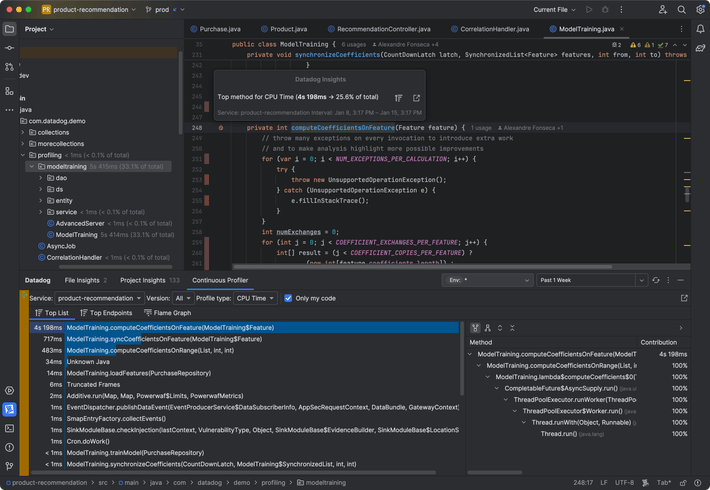
Optimize development code with visibility into production performance
- Easily locate your top resource-consuming lines of code, without switching tools, and reduce service cost
- Optimize your code’s CPU and memory consumption with production code profiling data
- Proactively address abnormal production code behavior, such as GC stalls and deadlocked threads
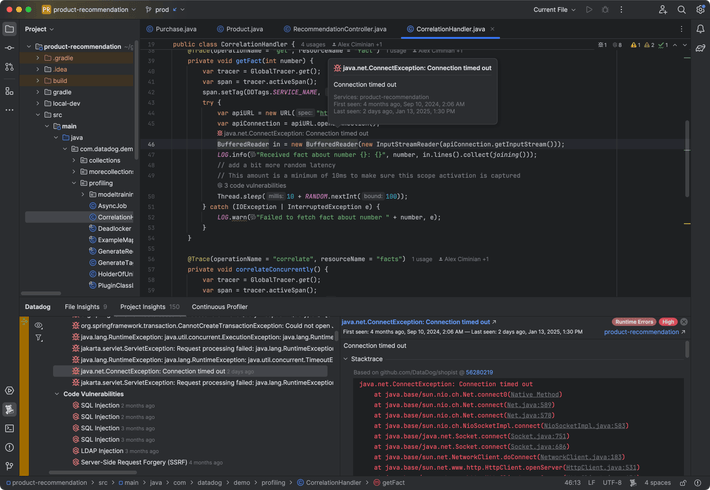
Decrease time to identify and resolve root causes of production issues
- Pivot seamlessly from a stack trace in Datadog to the relevant line of code in your IDE
- Resolve production issues more efficiently by easily acessing production data from the IDE
- Visualize production logs in Datadog associated with log lines in your code