
Feature Overview
Datadog Synthetic Monitoring is a proactive monitoring solution that enables you to create code-free API, browser, and mobile tests to automatically simulate user flows and requests to your applications, key endpoints, and network layers. Quickly detect user-facing issues and jump-start system-wide investigations so you can optimize performance and achieve reliable user experiences.
Proactively monitor end-to-end user flows with browser tests
- Easily create tests with customized assertions using our fully hosted codeless web recorder
- Reduce false alarms and alert fatigue with automatic detection of UI changes and updating of tests
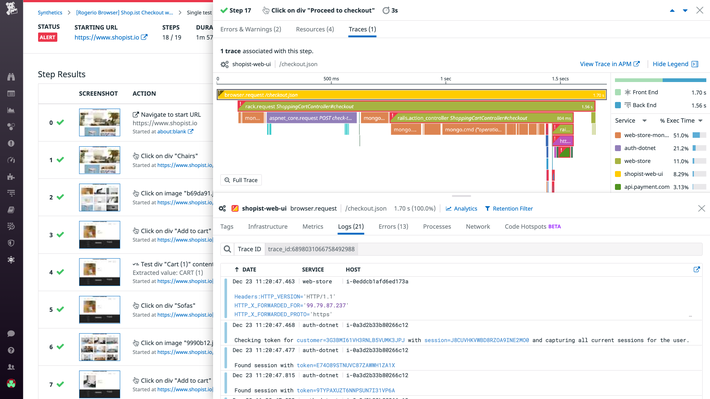
- Visualize user flows with step-by-step screenshots and Session Replay, and add key context with relevant network and performance metrics
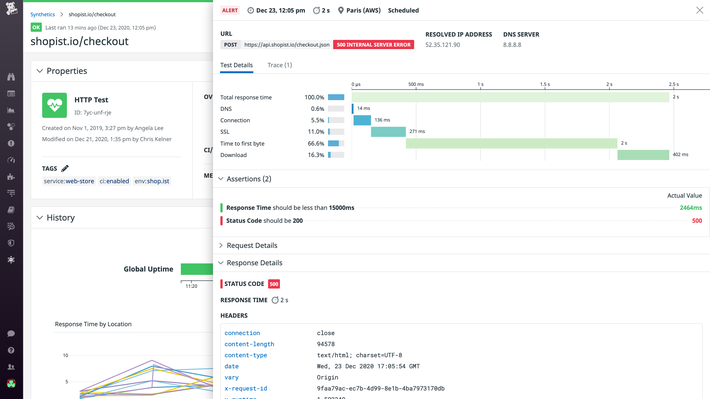
Track endpoint health and performance with API tests
- Validate all layers of your systems (HTTP, gRPC, SSL, DNS, WebSocket, TCP, UDP, and ICMP) from global managed and private locations
- View a breakdown of network timing data for faster root cause analysis
- Verify key user flows at the API level by chaining API requests together in multistep tests
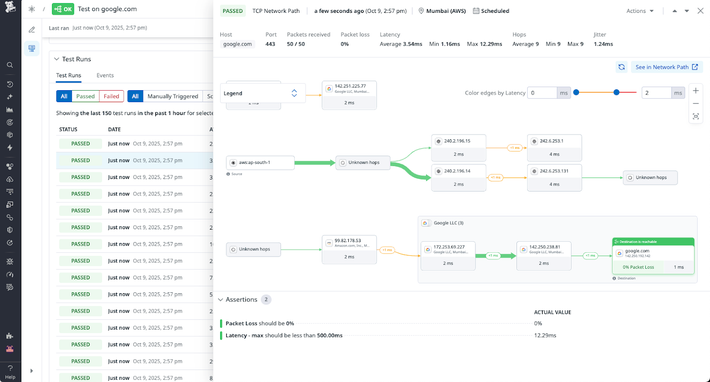
Uncover Root Causes Fast with Full Application-to-Network Visibility
- Pinpoint root cause fast and see if failures come from the application or network
- Test real world conditions from globally managed locations and hosts running the Datadog agent
- Proactively catch issue to get alerts on packet loss or latency
One suite for all testing needs
- Incorporate end-to-end tests into your CI pipelines for early issue detection, prevention, and remediation for web and mobile applications
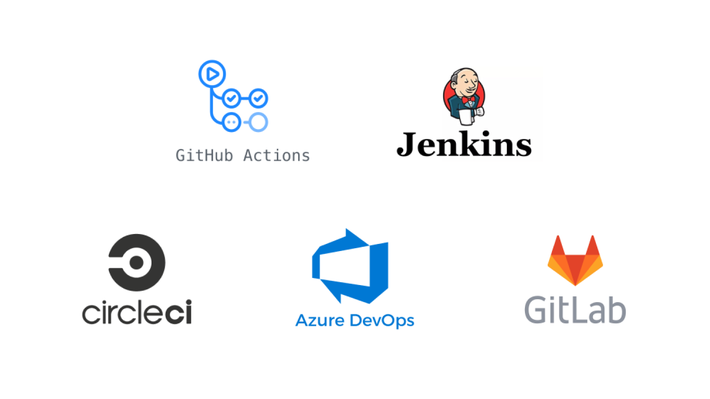
- Use our integrations with popular CI providers (GitHub, GitLab, Jenkins, CircleCI, Azure DevOps) and collaboration tools (Slack, Jira) to merge workflows and avoid context-switching
- Streamline collaboration by eliminating the need for teams to maintain separate testing scenarios, helping improve efficiency, release velocity, and business agility
Reduce mean time to resolution with full-stack visibility
- Gain the full context for troubleshooting failed tests—without switching between tools—through correlated metrics, traces, logs, and session replays surfaced by Datadog APM and RUM integration
- Visualize application uptime and performance data alongside key business metrics, helping you track your SLAs and SLOs
- Gain deep visibility into your internet stack—including CDNs, SaaS APIs, cloud providers, and networks—to pinpoint issues and eliminate unnecessary troubleshooting cycles
BENEFITS OF END-TO-END OBSERVABILITY EBOOK
Break down frontend and backend silos with full-stack observability