 |
VOOZH | about |
|
VOOZH | about |
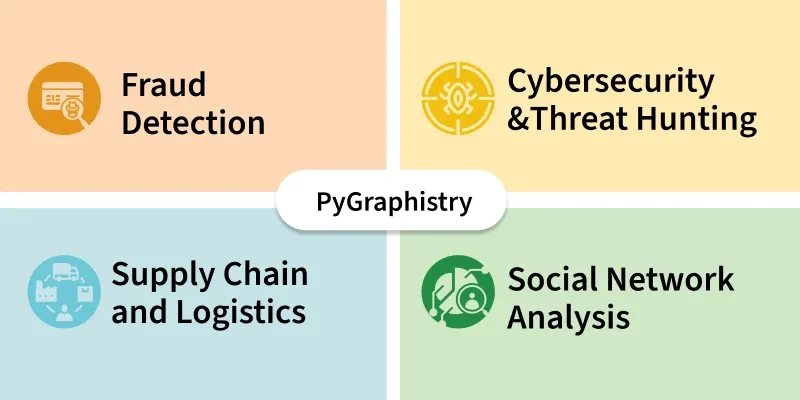
PyGraphistry is an open source Python library that enables visual graph analytics at scale. It acts as a Python interface to the Graphistry platform which turns raw data into interactive graph visualizations powered by GPUs. It helps analysts and data scientists explore complex relationships such as fraud rings, communication patterns and user behavior by converting datasets into graphs where nodes represent entities and edges represent relationships. It is useful in domains like cybersecurity, fraud detection, supply chains, social networks and healthcare anywhere graph relationships matter.
You start with your raw data usually tabular data like CSVs, database exports or Pandas DataFrames that represent entities (nodes) and their relationships (edges).
Using PyGraphistry’s Python API you specify which columns represent the source nodes, destination nodes and optionally any attributes for edges or nodes.
PyGraphistry sends the graph data to the Graphistry backend which uses GPU accelerated rendering and graph processing engines to handle large and complex networks efficiently.
The backend returns an interactive web visualization that you can explore in your browser. You can zoom, pan, filter, search and inspect nodes or edges to uncover insights visually.
As it’s tightly integrated with Python you can easily iterate by updating data, changing bindings or applying filters then regenerate the graph instantly.
Output:
0.41.0
The graphistry.register() function sets up a secure connection to Graphistry’s cloud server using API version 3. It includes your personal key ID and secret for authentication. This enables you to send data and create visualizations through your account.
Output:
<graphistry.pygraphistry.GraphistryClient at 0x780d4652db10>
It defines a function that takes raw email text, parses it to extract the main headers From, To and Subject and returns them while handling any parsing errors gracefully.
This code applies the email header parsing function to each message in the DataFrame, expands the results into separate columns, removes rows with missing data and renames the From and To columns to src and dst for clearer source destination labeling.
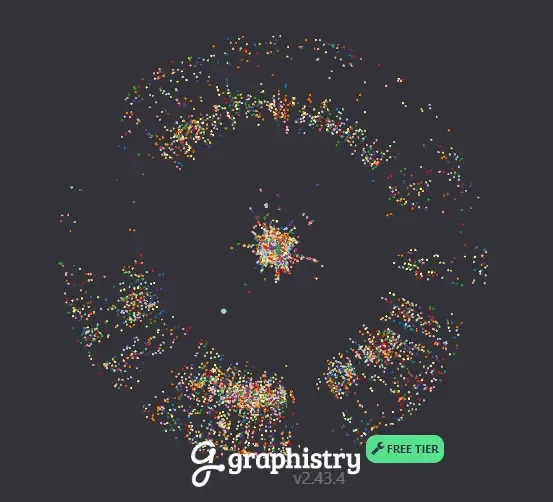
This command binds the src and dst columns as graph nodes, uses the DataFrame rows as edges and generates an interactive graph visualization of the network relationships.
Output: