 |
VOOZH | about |
|
VOOZH | about |
Spectral imaging integrates two distinct fields: spectroscopy and photography, to capture image data across numerous wavelength bands. Typically, spectral imaging is categorized into multispectral, which involves sampling fewer than 20 wavelength bands, and hyperspectral, which encompasses sampling more than 20 wavelength bands.
In this article, we are going to discuss What Hyperspectral Imaging means and where it is used in detail.
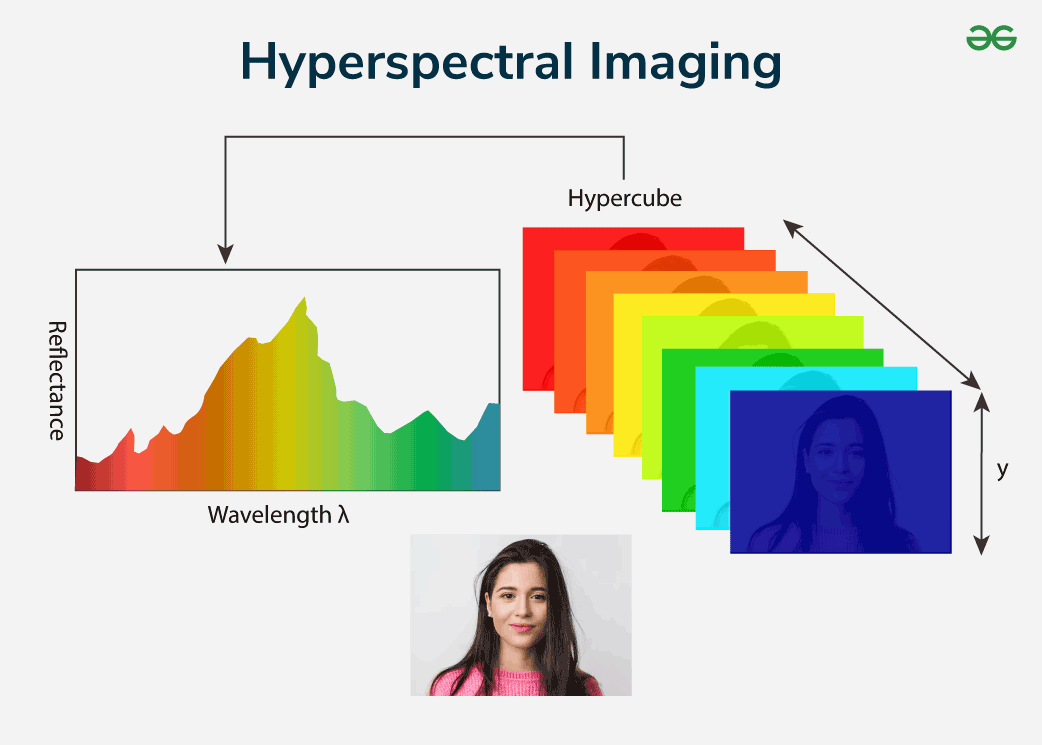
Hyperspectral imaging (HSI) integrates optical spectroscopy with imaging, creating a multidimensional dataset where each pixel contains both spatial and spectral information. This results in a three-dimensional data cube (Hypercube), with spectral bands representing different wavelengths. These bands typically sample more than 20 equally distributed wavelengths, extending beyond the visible range into ultraviolet and infrared regions.
Below are the differences between RGB images multispectral images and hyperspectral images:
Property | RGB Images | Multispectral images | Hyperspectral images |
|---|---|---|---|
Color Representation | These visuals depict primary light colors, red, green, and blue, with various shades created by blending these colors at varying strengths. | These pictures offer a more comprehensive color depiction than RGB photographs by capturing data in specific electromagnetic spectrum wavelength bands. | Photos provide comprehensive spectral information about objects or settings, covering a wide range of wavelengths and channels, enabling accurate analysis. |
Spectral Information | RGB images are limited in spectral data, capturing information from three narrow bands (red, green, and blue) in the visible spectrum. | These images provide enhanced spectral data by capturing information from multiple specific bands in the spectrum, including non-visible wavelengths. | These images offer detailed spectral data across various bands, covering a broad range of wavelengths, enabling comprehensive analysis and identification of materials and features. |
Number of Bands | These images contain only three bands, corresponding to red, green, and blue. | Multispectral images typically have below 20 bands, focusing on specific sections of the electromagnetic spectrum. | Hyperspectral images have more than 20 bands, often covering the entire electromagnetic spectrum with high resolution. |
Common Usage | RGB images are commonly used for standard color imaging, such as photography and visual displays. | Multispectral images are utilized for specific band analysis, especially in applications requiring specific wavelength ranges. | Hyperspectral images enable comprehensive analysis across various wavelengths, aiding in the identification of materials and features. |
Applications | RGB images are primarily used in photography, video, and displays. | Multispectral images are used in agriculture, environmental monitoring, and other fields where specific bands analysis can yield valuable insights. | Hyperspectral images are utilized in scientific research, such as agriculture, environmental monitoring, and geological exploration, to provide detailed information for material identification and analysis. |
These are the general steps we need to follow:
This is how we analyze Hyperspectral image data.
Advantages | Disadvantages |
|---|---|
HSI captures hundreds to thousands of narrow, continuous spectral bands. | HSI systems are often more expensive than traditional imaging systems, both in terms of equipment and operational costs. |
HSI provides a detailed spectral signature of materials, enabling highly precise discrimination between substances that look similar in traditional imaging. | The high dimensionality of hyperspectral data requires specialized software, substantial computing power, and expertise in analysis techniques. |
HSI can be used in wide range of applications such as agriculture, mineralogy, food industry etc... | HSI produces vast amounts of data, posing challenges in storage, management, and processing. |
The in-depth spectral analysis allows for the identification and mapping of specific chemical components within a sample or environment. | HSI data can be susceptible to noise and interference, requiring careful calibration and potential noise-reduction techniques. |
HSI is a non-invasive analysis method making it suitable for sensitive samples across diverse fields. | HSI systems have a smaller field of view compared to traditional cameras, making them less suitable for some large-scale imaging applications. |