 |
VOOZH | about |
|
VOOZH | about |
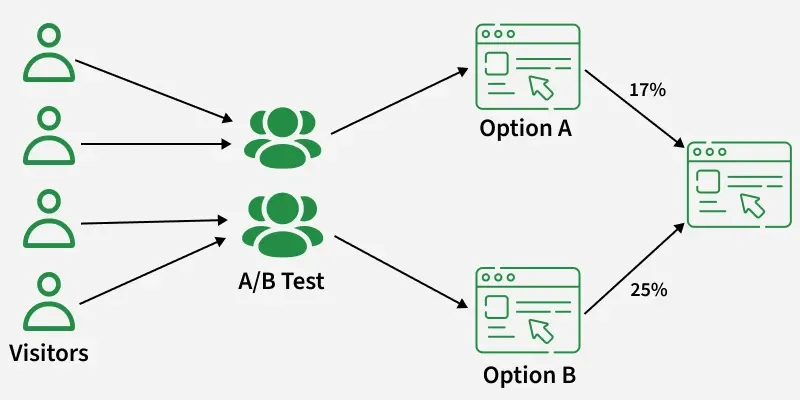
A/B testing is a way to compare two versions of something to find out which one works better. In this you divide people into two groups, show them different versions and then measure which version performs better based on a specific goal. Suppose you're sending out two different email subject lines to people and you want to see which one gets more people to open the email.
After sending count how many people open each email. If more people open the email from Group B you can decide that the second subject line is better. As you can see, Option B works better than Option A because more people responded to it (25% compared to 17%).
To understand more about A/B testing first you have to learn these concepts:
Before you start any A/B test you need to come up with a hypothesis. Think of it as a smart guess about what you believe will happen in the experiment. For example if you’re testing two versions of a website button then your hypothesis would be: “I think changing the color of the button from blue to green will make more people click it. A clear hypothesis gives your test direction.
Next we need to make sure the users are split into two groups: the control group and the experimental group. This is where randomization comes in. The control group (A) will see the original version of what you're testing. The experimental group (B) will see the new or changed version. It is done to avoid bias in test results.
Sample size means how many people you need to include in your test. You want enough people to get reliable results but not too many that it wastes resources. The more people you test the more accurate your results will be.
Now that your test is set up you need to decide what you’re measuring. These are called performance metrics or KPIs (Key Performance Indicators). These are the things you’ll look at to see if your changes worked. Some common performance metrics include:
They help you measure success. Without them you wouldn’t know if the change you made actually improved anything.
Finally once you’ve collected the data from your test you need to analyze it to see if the changes you made were really effective. This is done using statistical methods.
Let’s take a real-world example to understand A/B Testing. Suppose you are working for an e-commerce company that wants to improve user engagement by testing a new machine learning–based recommendation system against their current rule-based system. The goal is to determine whether the new model actually improves engagement before fully implementing it.
Before running the A/B test you must clearly define what you are testing and how success will be measured.
A/B testing requires splitting users into two groups randomly:
The groups must be of similar size to ensure statistical validity.
Once the A/B test is live we need to track key performance indicators (KPIs) that help us measure the impact of the change. Common KPIs include:
Example: If 1,000 users see recommendations and 150 click on them then CTR is:
Data collection should run long enough to capture a representative sample of user behavior.
Once we have collected sufficient data we need to analyze whether the observed differences between the control and test groups are statistically significant.
Key statistical measures used:
Before its implementation we should have some basic knowledge about numpy and scipy.
Output:
Control CTR: 12.00%
Test CTR: 15.00%
Chi-Square Test p-value: 0.00000
The difference is statistically significant. Implement the new recommendation system.
After analyzing the results there are two possible outcomes:
1. If the test group performs significantly better (p < 0.05):
2. If results are inconclusive (p > 0.05):
Several tools make running A/B tests easier and more effective: