 |
VOOZH | about |
|
VOOZH | about |
Containerization has transformed software development by providing portability and consistency through platforms like Docker. Yet ensuring the health of those containerized applications requires monitoring. Prometheus is a monitoring tool that uses its powerful features to monitor the application and make sure that the application is in good health. In this article first, you will understand what is, and then I will guide you through the steps to monitor your Docker container by using Prometheus.
Prometheus is an open-source monitoring and alerting toolkit, which collects time series data from various sources, allowing users to monitor and analyze metrics related to system performance. It also monitors resource utilization and application location.
wget https://release-assets.githubusercontent.com/github-production-release-asset/6838921/b3566c83-19c4-41fe-9b58-ec142134daec?sp=r&sv=2018-11-09&sr=b&spr=https&se=2025-07-23T12%3A24%3A10Z&rscd=attachment%3B+filename%3Dprometheus-2.48.1.linux-amd64.tar.gz&rsct=application%2Foctet-stream&skoid=96c2d410-5711-43a1-aedd-ab1947aa7ab0&sktid=398a6654-997b-47e9-b12b-9515b896b4de&skt=2025-07-23T11%3A23%3A12Z&ske=2025-07-23T12%3A24%3A10Z&sks=b&skv=2018-11-09&sig=ZK2HC03vXuoSjFkOKsN6yRZhVBpejiTddCaZRFMKysY%3D&jwt=eyJhbGciOiJIUzI1NiIsInR5cCI6IkpXVCJ9.eyJpc3MiOiJnaXRodWIuY29tIiwiYXVkIjoicmVsZWFzZS1hc3NldHMuZ2l0aHVidXNlcmNvbnRlbnQuY29tIiwia2V5Ijoia2V5MSIsImV4cCI6MTc1MzI3MDUzOSwibmJmIjoxNzUzMjcwMjM5LCJwYXRoIjoicmVsZWFzZWFzc2V0cHJvZHVjdGlvbi5ibG9iLmNvcmUud2luZG93cy5uZXQifQ.q-uguVbL_bTPH1QN5ntOfrpxhnxdFAmMqR3Ab_X_8SM&response-content-disposition=attachment%3B%20filename%3Dprometheus-2.48.1.linux-amd64.tar.gz&response-content-type=application%2Foctet-stream
tar xvfz prometheus-2.48.1.linux-amd64.tar.gz
👁 install-prometheus-on-ubuntu
curl -LO https://release-assets.githubusercontent.com/github-production-release-asset/6838921/6fa33639-640a-4b39-a36c-5a6ae20e6422?sp=r&sv=2018-11-09&sr=b&spr=https&se=2025-07-23T12%3A21%3A16Z&rscd=attachment%3B+filename%3Dprometheus-2.49.1.windows-amd64.zip&rsct=application%2Foctet-stream&skoid=96c2d410-5711-43a1-aedd-ab1947aa7ab0&sktid=398a6654-997b-47e9-b12b-9515b896b4de&skt=2025-07-23T11%3A20%3A43Z&ske=2025-07-23T12%3A21%3A16Z&sks=b&skv=2018-11-09&sig=RBnZRtTdOe%2BHcWJSAP1SG0PHG1KE14WTKw4ifHvqFZw%3D&jwt=eyJhbGciOiJIUzI1NiIsInR5cCI6IkpXVCJ9.eyJpc3MiOiJnaXRodWIuY29tIiwiYXVkIjoicmVsZWFzZS1hc3NldHMuZ2l0aHVidXNlcmNvbnRlbnQuY29tIiwia2V5Ijoia2V5MSIsImV4cCI6MTc1MzI3MDUzOSwibmJmIjoxNzUzMjcwMjM5LCJwYXRoIjoicmVsZWFzZWFzc2V0cHJvZHVjdGlvbi5ibG9iLmNvcmUud2luZG93cy5uZXQifQ.q-uguVbL_bTPH1QN5ntOfrpxhnxdFAmMqR3Ab_X_8SM&response-content-disposition=attachment%3B%20filename%3Dprometheus-2.49.1.windows-amd64.zip&response-content-type=application%2Foctet-stream
unzip prometheus-2.49.1.windows-amd64.zip
vi /etc/docker/daemon.json{
"metrics-addr": "0.0.0.0:9323",
"experimental":true
}
👁 Adding metrics in docker daemon.json file
sudo service docker restart{
"builder": {
"gc": {
"defaultKeepStorage": "20GB",
"enabled": true
}
},
"experimental": true,
"metrics-addr": "0.0.0.0:9323"
}
Then you can save and restart the docker desktop .
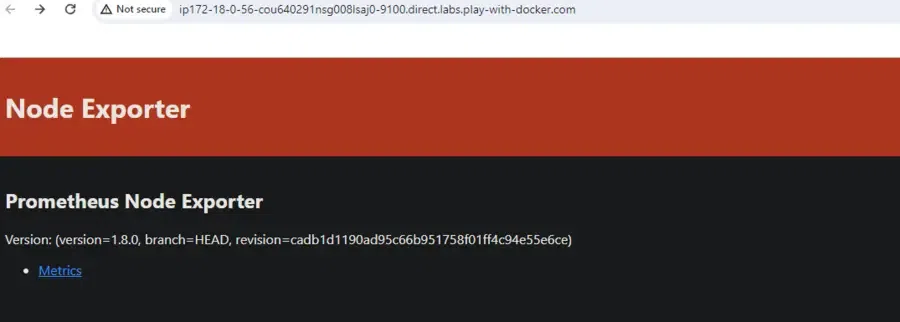
A small application called Node Exporter is installed on your PC or server. It functions similar to a detective who is always monitoring the system and collecting information about things like CPU, RAM, disk space, and other things. subsequently, it propagates this data to Prometheus and other monitoring tools.
Here are the steps to set up Node Exporter on Linux:
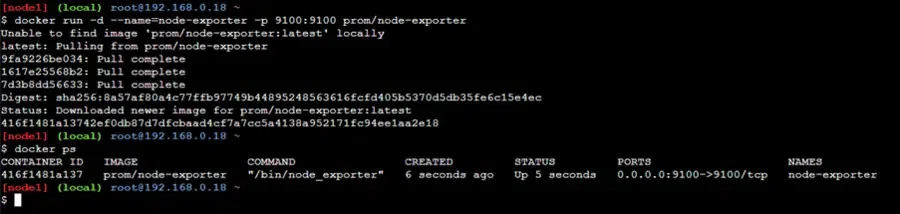
Run the Node Exporter Container: Node Exporter image, run the container with the following command:
docker run -d --name=node-exporter -p 9100:9100 prom/node-exporterList the container by using the below command
docker pscd prometheus-2.48.1.linux-amd64
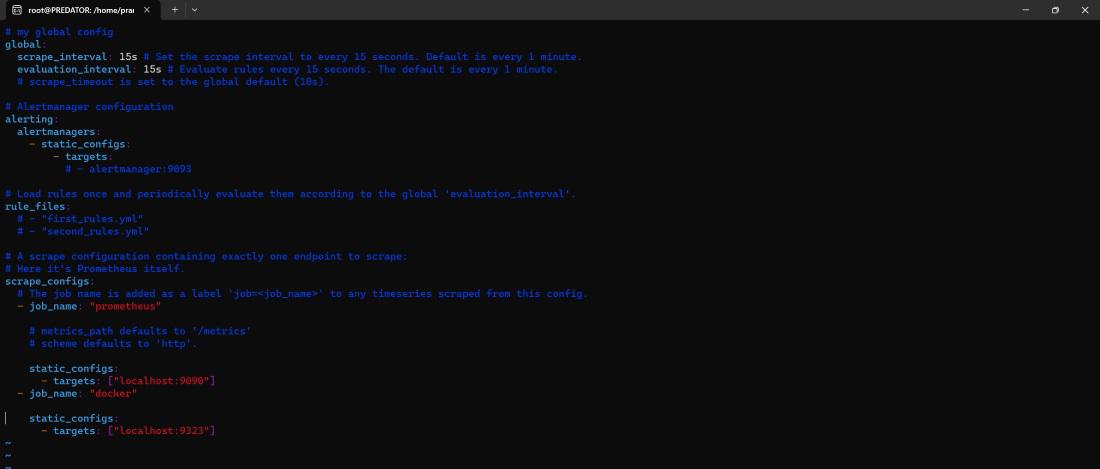
vi prometheus.yml
Here is the simple and sample scrap config file. Based on your requirements update the scrap config file.
global:
 scrape_interval: 10s
scrape_configs:
 - job_name: promethheus
 static_configs:
 - targets:
 - localhost:9090
 - job_name: docker
 static_configs:
 - targets:
 - localhost:9323
cd prometheus-2.49.1.windows-amd64
vi prometheus.yml
👁 editing prometheusyml-on-windows
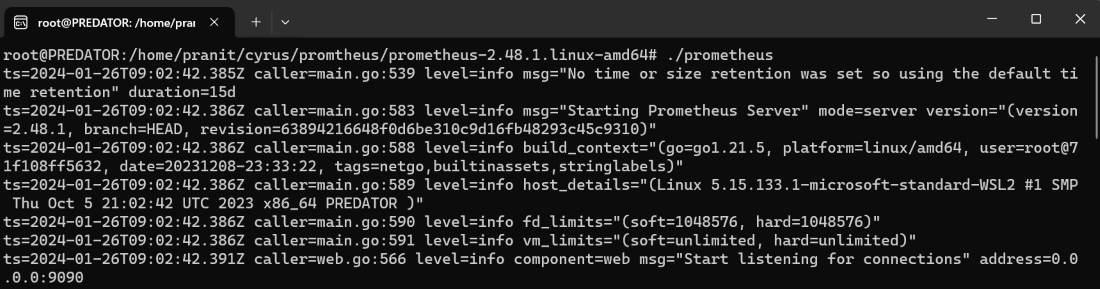
./prometheus👁 run-prometheus-server-on-ubuntu
./prometheus.exe
tar -xzf alertmanager-*.tar.gz./alertmanager --config.file=alertmanager.ymlYou may want to run Alertmanager as a background service or use tools like Systemd to manage it as a service.
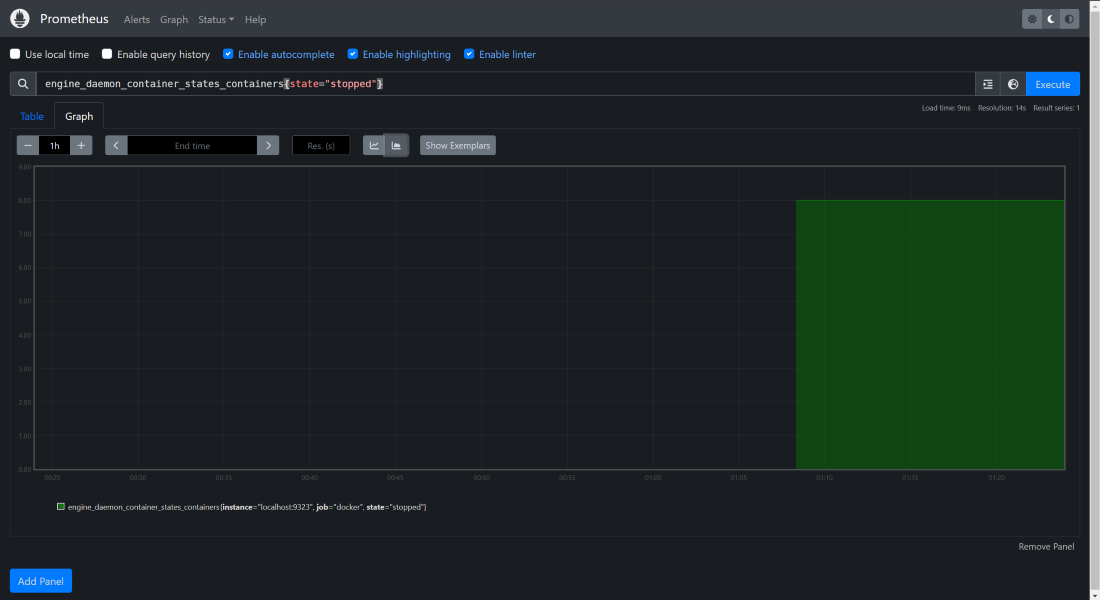
There are many metrics exposed in http://localhost:9323/metrics. You can choose any query and execute it on the Prometheus server. For example, to see the number of containers in stop state use this query "engine_daemon_container_states_containers{state="stopped"}"
👁 Viewing the containers in-stopped-state
To know more about the Installation of Docker, Read this Article.
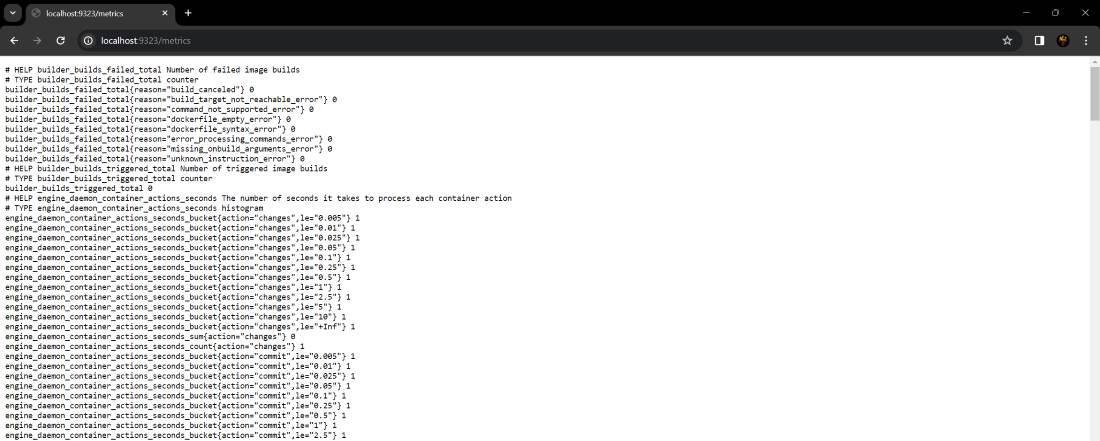
Docker Metrics: We can visit this URL to see all the exposed metrics of your Docker service.
http://localhost:9323/metricsConsider Pushgateway as a metrics mailbox. Prometheus typically gathers metrics from your various services and machines on its own. Yet, some objects, like temporary jobs, are not always capable of sending measures directly to Prometheus.
Basically, Pushgateway acts as a mailbox for these jobs to deposit their measurements. Prometheus then visits, checks the mailbox and gets those metrics. In this manner, your monitoring system incorporates even difficult metrics from contract work!
Article | Link |
|---|---|
Installation of Docker on Ubuntu | |
Installation of Docker on Windows |
You have first understood what is Prometheus. Then you have then learned about how to install Prometheus and configure Prometheus to extract metrics from your Docker containers. At the end, you have also executed a PromQL query to see a number of containers in the stopped state. You have now successfully completed all the steps to use Prometheus to monitor docker containers.