VOOZH about

URL: https://www.geeksforgeeks.org/ethical-hacking/intro-to-wireshark/

⇱ Introduction to Wireshark - GeeksforGeeks


  • Courses
  • Tutorials
  • Interview Prep

Introduction to Wireshark

Last Updated : 28 Apr, 2026

Wireshark is a free and open-source network protocol analyzer used to monitor and analyze network traffic at a granular level. It allows users to inspect data packets flowing across a network in real time or from saved captures. This makes it a critical tool for understanding network behavior, diagnosing issues and investigating security incidents.

  • Supports detailed packet inspection with decoding of hundreds of network protocols
  • Allows filtering of traffic to focus on specific packets or communication streams
  • Enables offline analysis using previously captured network data
  • Provides a graphical interface for easier visualization of packet-level details
  • Widely used in network forensics and incident analysis

Key Features

Wireshark analyzes network packets in detail, similar to how a voltmeter inspects electrical signals.

1. Live Capture & File Input

  • Capture from Ethernet, Wi-Fi (monitor mode), USB, Bluetooth, loopback, etc.
  • Supports pcap/pcapng formats; compatible with tcpdump and tshark
  • Can open, save, merge and replay capture files

2. Protocol Decodes & Dissectors

  • Supports hundreds of protocols: Ethernet, IP, TCP/UDP, HTTP, VoIP, USB & more
  • Add custom protocol dissectors using plugins or Lua scripts

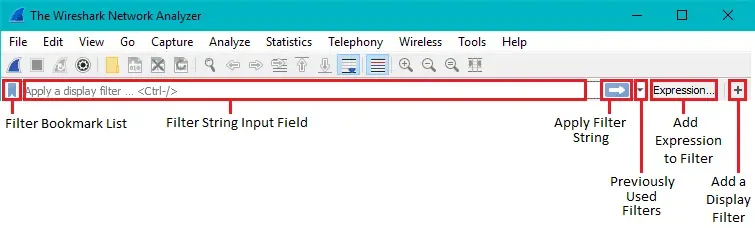
3. Filtering & Search Tools

  • Capture filters (BPF) to limit traffic before capture
  • Display filters for precise viewing (e.g., http, ip.addr == 192.168.1.1)
  • Powerful search, follow-stream and packet-tracing tools

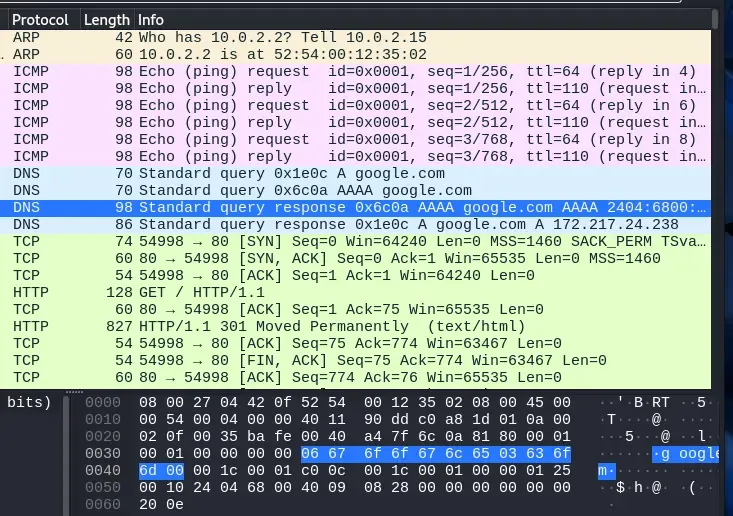
4. Color Coding & Customization

  • Color rules to highlight errors, retransmissions, suspicious traffic
  • Custom profiles for columns, filters and layouts

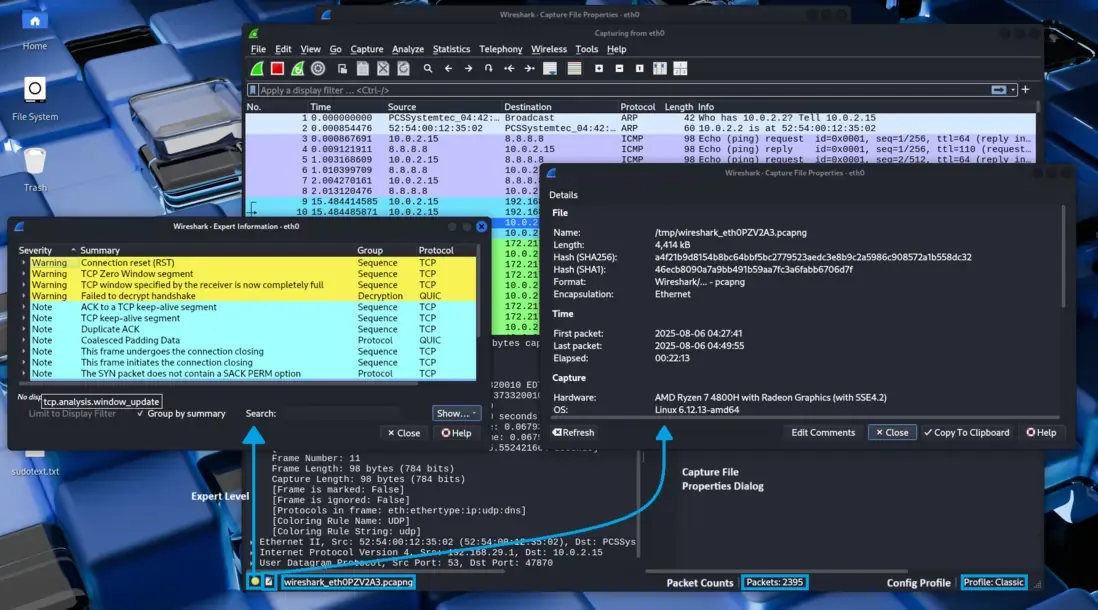
5. Statistics & Analysis Tools

  • Protocol hierarchy, IO graphs, flow graphs
  • VoIP analysis, wireless metrics, expert system alerts
  • Export stats for reporting or forensic analysis

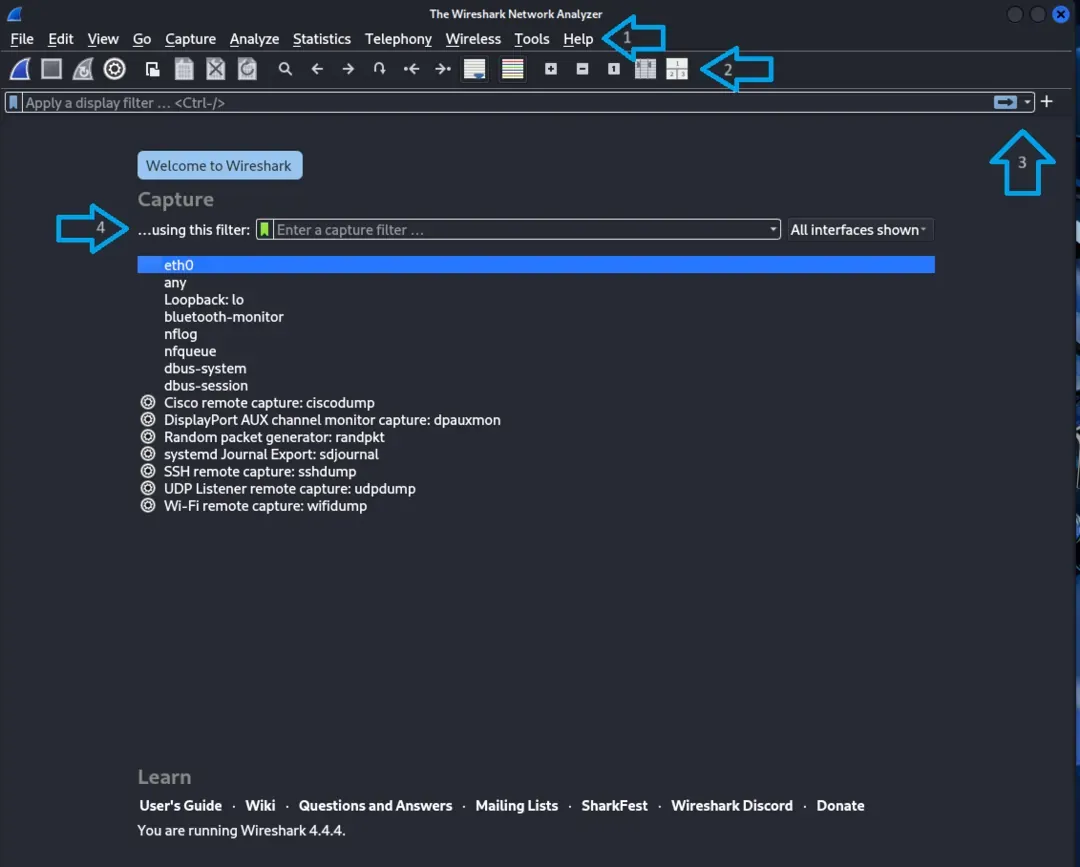
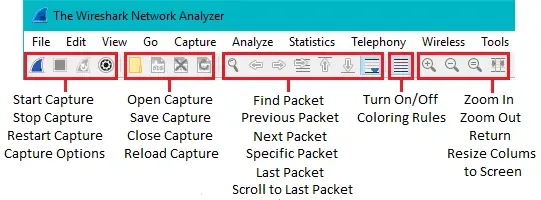
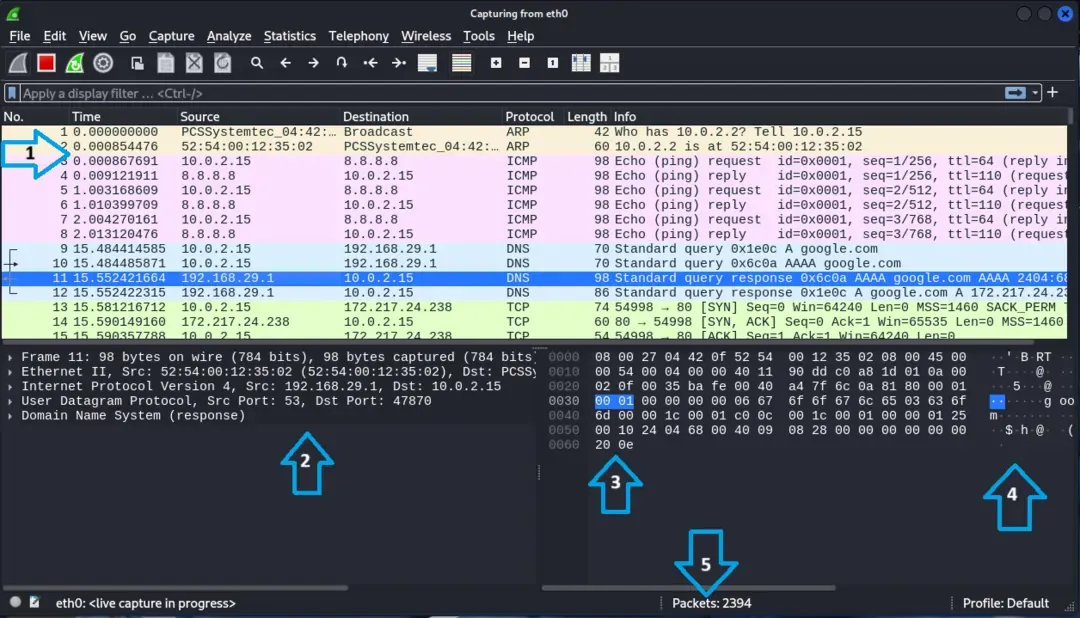
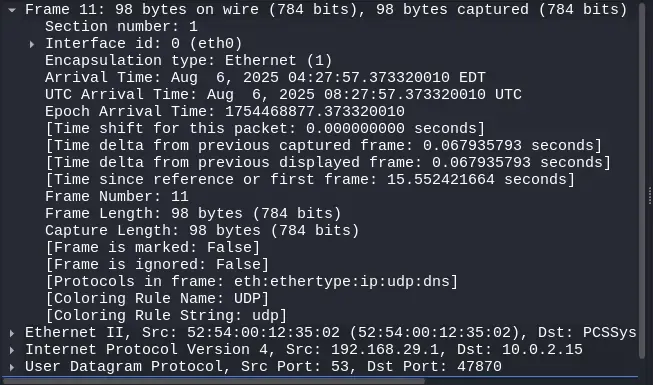
Interface Overview (Core GUI Components)

Wireshark’s main window is organized into several interactive areas:

πŸ‘ ws_main_window

1. Menu Bar

  • Full access to capture, filters, statistics, telephony tools, wireless tools

2. Main Toolbar

  • Quick buttons for start/stop capture, open/save files, restart capture
πŸ‘ menu_bar

3. Filter Toolbar

  • Capture filter (before capture)
  • Display filter (after capture) with real-time validation
πŸ‘ toolbar

4. Interface List (Start Screen)

  • Shows available network adapters and their current traffic
  • Select interface + optional capture filter before starting
πŸ‘ wireshark-interface-list-diagram

Main Pane Layout (post capture)

You can also enable the Packet Diagram Pane to get a visual, textbook-style representation of packet headers and payload structure.

πŸ‘ menu_post_cap

1. Packet List Pane

  • Table view of all packets: Time, Source, Destination, Protocol, Info
  • Columns fully customizable

2. Packet Details Pane

  • Layer-by-layer breakdown: Ethernet -> IP -> TCP/UDP -> Application
  • Expandable and clickable fields
πŸ‘ detail_pane

3. Packet Bytes Pane

  • Raw hex + ASCII view
  • Linked highlighting with Details Pane
πŸ‘ bytes_pane

4. Packet Diagram Pane

  • Visual representation of packet structure (header + payload)

5. Status Bar

  • Shows packet stats, filter validation, dropped packets, file path
πŸ‘ Statusbar

Usage Workflow

  • Open Wireshark and select the desired network interface.
  • Apply a capture filter before starting the capture. (Optional)
  • Start the capture and allow network traffic to flow.
  • Stop the capture once sufficient data has been collected.
  • Apply display filters to isolate specific packets or traffic.
  • Inspect packets using the packet details and byte views.
  • Use statistical tools (e.g., flow graphs, protocol hierarchy) for deeper analysis.
  • Save or export the capture for documentation or further investigation.
Comment