 |
VOOZH | about |
|
VOOZH | about |
The Statistics is a branch of mathematics that deals with the collection, analysis, interpretation and presentation of the data. Chapter 14 of the Class 10 NCERT textbook introduces students to the statistical concepts such as the mean, median, mode and representation of data through the graphical methods. Exercise 14.4 focuses on applying cumulative frequency distributions to the calculate and interpret the median.
The Statistics involves organizing data in such a way that it provides meaningful insights enabling the decision-making based on trends or patterns. It is commonly used in the fields such as the economics, biology and social sciences to the quantify and analyze real-world phenomena. In this chapter, students will learn to calculate measures of central tendency and how to represent data visually using the graphs like histograms and cumulative frequency curves.
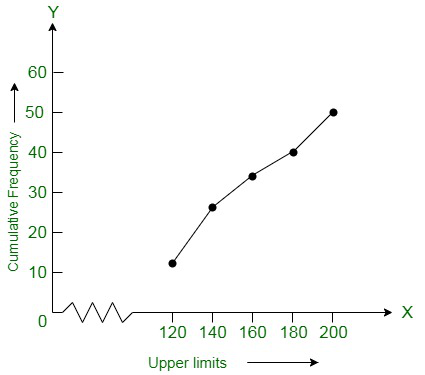
| Daily income in Rupees | 100-120 | 120-140 | 140-160 | 160-180 | 180-200 |
| Number of workers | 12 | 14 | 8 | 6 | 10 |
Solution:
According to the question, we convert the given distribution to a less than type cumulative frequency distribution,
Daily income Frequency Cumulative Frequency Less than 120 12 12 Less than 140 14 26 Less than 160 8 34 Less than 180 6 40 Less than 200 10 50 Now according to the table we plot the points that are corresponding to the ordered pairs (120, 12), (140, 26), (160, 34), (180, 40), and (200, 50) on a graph paper. Here x-axis represents the upper limit and y-axis represent the frequency. The curve obtained from the graph is known as less than type ogive curve.
| Weight in kg | Number of students |
| Less than 38 | 0 |
| Less than 40 | 3 |
| Less than 42 | 5 |
| Less than 44 | 9 |
| Less than 46 | 14 |
| Less than 48 | 28 |
| Less than 50 | 32 |
| Less than 52 | 35 |
Solution:
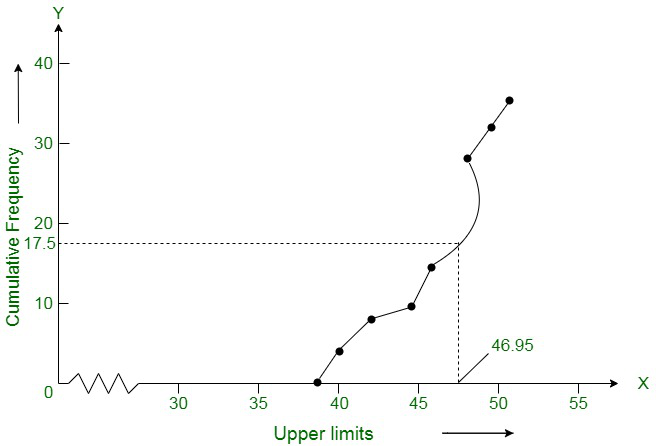
According to the given table, we get the points (38, 0), (40, 3), (42, 5), (44, 9), (46, 14), (48, 28), (50, 32) and (52, 35). Now using these points we draw an ogive, where the x-axis represents the upper limit and y-axis represents the frequency. The curve obtained is known as less than type ogive.
👁 Class 10 NCERT Chapter 14 Exercise 14.4 Solution
Now, locate the point 17.5 on the y-axis and draw a line parallel to the x-axis cutting the curve at a point. From this point, now we draw a perpendicular line to the x-axis and the intersection point which is perpendicular to x-axis is the median of the given data. After, locating point now we create a table to find the mode:
Class interval Number of students(Frequency) Cumulative Frequency Less than 38 0 0 Less than 40 3 - 0 = 3 3 Less than 42 5 - 3 = 2 8 Less than 44 9 - 5 = 4 9 Less than 46 14 - 9 = 5 14 Less than 48 28 - 14 = 14 28 Less than 50 32 - 28 = 4 32 Less than 52 35 - 22 = 3 35 The class 46 – 48 has the maximum frequency, hence, this is the modal class
l = 46, h = 2, f1 = 14, f0 = 5 and f2 = 4
Now we find the mode:
Mode =
On substituting the values in the given formula, we get
= 46 + 0.95 = 46.95
Hence, the mode is verified.
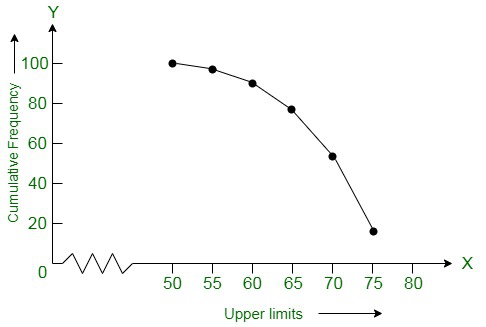
| Production Yield | 50-55 | 55-60 | 60-65 | 65-70 | 70-75 | 75-80 |
| Number of farms | 2 | 8 | 12 | 24 | 38 | 16 |
Solution:
According to the question, we change the distribution to a more than type distribution.
Production Yield (kg/ha) Number of farms More than or equal to 50 100 More than or equal to 55 100 - 2 = 98 More than or equal to 60 98 - 8 = 90 More than or equal to 65 90 - 12 = 78 More than or equal to 70 78 - 24 = 54 More than or equal to 75 54 - 38 = 16 Now, according to the table we draw the ogive by plotting the points. Here, the a-axis represents the upper limit and y-axis represents the cumulative frequency. And the points are(50, 100), (55, 98), (60, 90), (65, 78), (70, 54) and (75, 16) on this graph paper. The graph obtained is known as more than type ogive curve.
The Statistics is an essential tool in understanding data and making informed decisions. Exercise 14.4 of Chapter 14 provides the practical insights into the how to use cumulative frequency distributions to find the median. By mastering these concepts students will develop critical thinking and data interpretation skills that are applicable in the various real-life situations.