 |
VOOZH | about |
|
VOOZH | about |
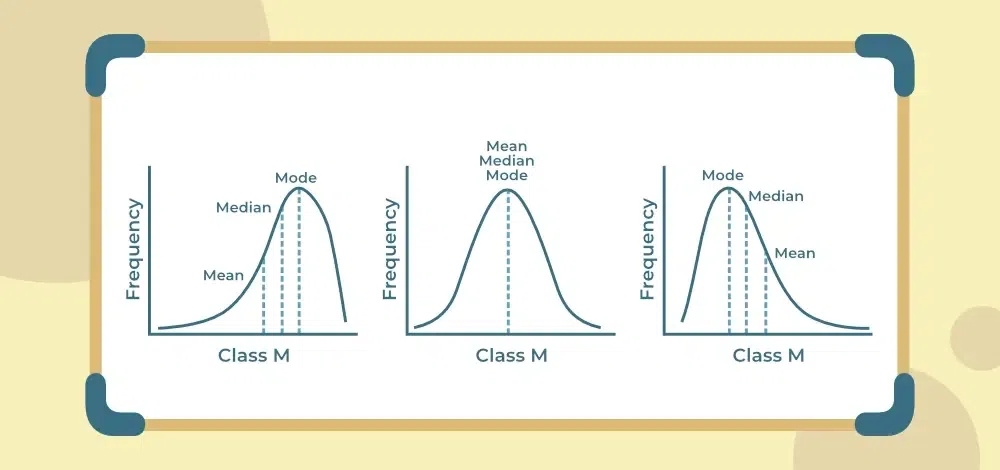
Central tendencies in statistics are numerical values that represent the middle or typical value of a dataset. Also known as averages, they provide a summary of the entire data, making it easier to understand the overall pattern or behavior. These values are useful because they capture the essence of large datasets in a single, representative number.
The representative value of a data set, generally the central value or the most occurring value that gives a general idea of the whole data set is called Measure of Central Tendency.
The three most commonly used measures of central tendency are mean, median, and mode.
Mean in general terms is used for the arithmetic mean of the data, but other than the arithmetic mean there are geometric mean and harmonic mean as well that are calculated using different formulas.
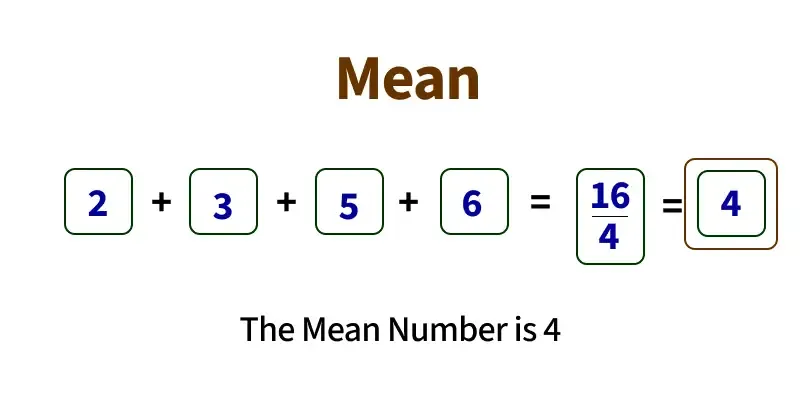
Arithmetic mean () is defined as the sum of the individual observations (xi) divided by the total number of observations N. In other words, the mean is given by the sum of all observations divided by the total number of observations.
OR
Mean = Sum of all Observations ÷ Total number of Observations
Example: If there are 5 observations, which are 27, 11, 17, 19, and 21, then the mean () is given by
= (27 + 11 + 17 + 19 + 21) ÷ 5
⇒ = 95 ÷ 5
⇒ = 19
Mean () is defined for the grouped data as the sum of the product of observations (xi) and their corresponding frequencies (fi) divided by the sum of all the frequencies (fi).
Example: If the values (xi) of the observations and their frequencies (fi) are given as follows:
xi | 4 | 6 | 15 | 10 | 9 |
|---|---|---|---|---|---|
fi | 5 | 10 | 8 | 7 | 10 |
then Arithmetic mean () of the above distribution is given by
= (4×5 + 6×10 + 15×8 + 10×7 + 9×10) ÷ (5 + 10 + 8 + 7 + 10)
⇒ = (20 + 60 + 120 + 70 + 90) ÷ 40
⇒ = 360 ÷ 40
⇒ = 9
Mean can be classified into three different class groups, which are
The Arithmetic Mean is the most common type of average. It is obtained by adding all the observations and then dividing by the total number of observations. It gives a simple average value representing the entire data set.
The formula for the Arithmetic Mean is given by
Where,
The Geometric Mean is used when the data values are multiplicative or vary exponentially, such as in growth rates, interest rates, or ratios. It is the nth root of the product of all observations.
The formula for Geometric Mean is given by
Where,
The Harmonic Mean is appropriate when the data consists of rates or ratios, such as speed, time, or efficiency.
It is calculated as the reciprocal of the arithmetic mean of reciprocals of the data values.
The formula for Harmonic Mean is given by
OR
Where,
There are various properties of Arithmetic Mean, some of which are as follows:
Median of any distribution is that value that divides the distribution into two equal parts such that the number of observations above it is equal to the number of observations below it. Thus, the median is called the central value of any given data, either grouped or ungrouped.
To calculate the Median, the observations must be arranged in ascending or descending order. If the total number of observations is N, then there are two cases
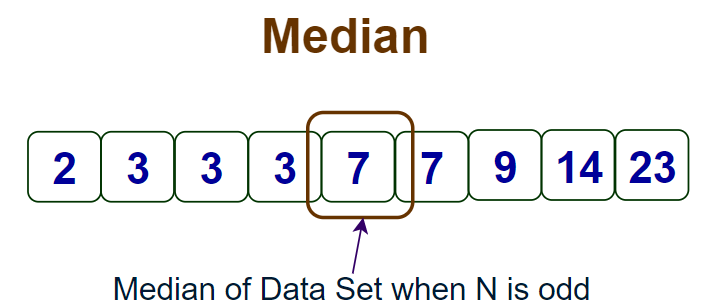
Case 1: When N is Odd
Median = Value of observation at [(n + 1) ÷ 2]th Position
When N is odd the median is calculated as shown in the image below.
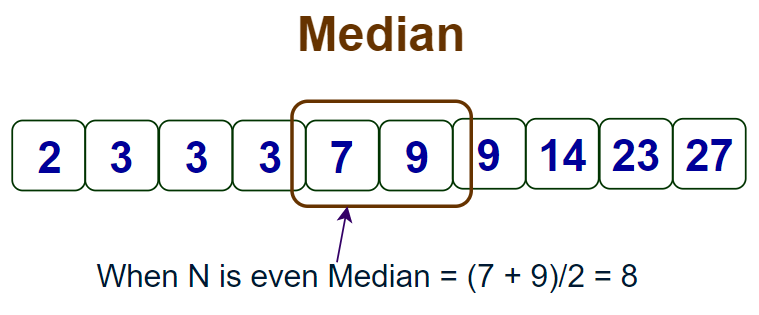
Case 2: When N is Even
Median = Arithmetic mean of Values of observations at (n ÷ 2)th and [(n ÷ 2) + 1]th Position
When N is even the median is calculated as shown in the image below.
👁 Median when n is evenExample 1: If the observations are 25, 36, 31, 23, 22, 26, 38, 28, 20, 32, then the Median is given by
Arranging the data in ascending order: 20, 22, 23, 25, 26, 28, 31, 32, 36, 38
N = 10 which is even then
Median = Arithmetic mean of values at (10 ÷ 2)th and [(10 ÷ 2) + 1]th position
⇒ Median = (Value at 5th position + Value at 6th position) ÷ 2
⇒ Median = (26 + 28) ÷ 2
⇒ Median = 27
Example 2: If the observations are 25, 36, 31, 23, 22, 26, 38, 28, 20, then the Median is given by
Arranging the data in ascending order: 20, 22, 23, 25, 26, 28, 31, 36, 38
N = 9 which is odd then
Median = Value at [(9 + 1) ÷ 2]th position
⇒ Median = Value at 5th position
⇒ Median = 26
Median of Grouped Data is given as follows:
Where,
Example: Calculate the median for the following data.
Class | 10 - 20 | 20 - 30 | 30 - 40 | 40 - 50 | 50 - 60 |
|---|---|---|---|---|---|
Frequency | 5 | 10 | 12 | 8 | 5 |
Solution:
Create the following table for the given data.
Class Frequency Cumulative Frequency 10 - 20
5
5
20 - 30
10
15
30 - 40
12
27
40 - 50
8
35
50 - 60
5
40
As n = 40 and n/2 = 20,
Thus, 30 - 40 is the median class.
l = 30, cf = 15, f = 12, and h = 10Putting the values in the formula
Median = 30 + (20 - 15)/12) × 10
⇒ Median = 30 + (5/12) × 10
⇒ Median = 30 + 4.17
⇒ Median = 34.17So, the median value for this data set is 34.17
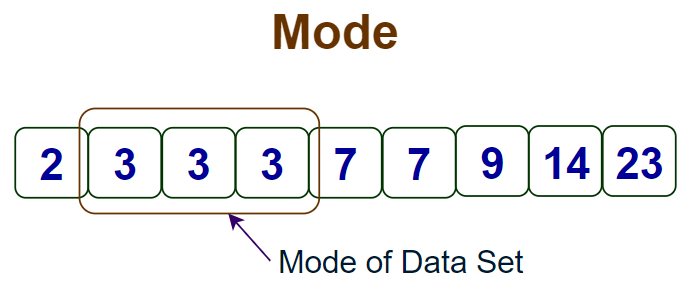
Mode is the value of that observation which has a maximum frequency corresponding to it. In other, that observation of the data occurs the maximum number of times in a dataset.
Mode of Ungrouped Data can be simply calculated by observing the observation with the highest frequency. Let's see an example of the calculation of the mode of ungrouped data.
The mode of the data set is the highest frequency term in the data set, as shown in the image added below.
👁 Mode of ungrouped dataExample: Find the mode of observations 5, 3, 4, 3, 7, 3, 5, 4, 3.
Solution:
Create a table with each observation with its frequency as follows:
xi
5
3
4
7
fi
2
4
2
1
Since 3 has occurred a maximum number of times i.e. 4 times in the given data;
Hence, Mode of the given ungrouped data is 3.
Formula to find the mode of the grouped data is:
Where,
Example: Find the mode of the dataset which is given as follows.
| Class Interval | 10-20 | 20-30 | 30-40 | 40-50 | 50-60 |
|---|---|---|---|---|---|
| Frequency | 5 | 8 | 12 | 16 | 10 |
Solution:
As the class interval with the highest frequency is 40-50, which has a frequency of 16. Thus, 40-50 is the modal class.
Thus, l = 40 , h = 10 , f1 = 16 , f0 = 12 , f2 = 10
Plugging in the values in formula , we get
Mode = 40 + (16 - 12)/(2 × 16 - 12 - 10) × 10
⇒ Mode = 40 + (4/10)×10
⇒ Mode = 40 + 4
⇒ Mode = 44Therefore, the mode for this set of data is 44.
The formulas for calculating mean, median, and mode vary slightly depending on whether the data is ungrouped or grouped. The table below summarizes the key formulas for each measure of central tendency:
| Measure | Ungrouped Data Formula | Grouped Data Formula |
|---|---|---|
Mean | ||
Median | Median = Value of observation at [(n + 1) ÷ 2]th Position (Odd) | |
Mode | Most frequent value |
The three central tendencies are related to each other by the empirical formula, which is given as follows:
2 × Mean + Mode = 3 × Median
This formula is used to calculate one of the central tendencies when two other central tendencies are given.