 |
VOOZH | about |
|
VOOZH | about |
Solution:
Present age of Aftab = x
And, the present age of his daughter = y
,
Age of Aftab = x-7
Age of his daughter = y-7
Age of Aftab = x+3
Age of his daughter = y+7
Here, According to the given condition,
x−7 = 7(y−7)
x−7 = 7y−49
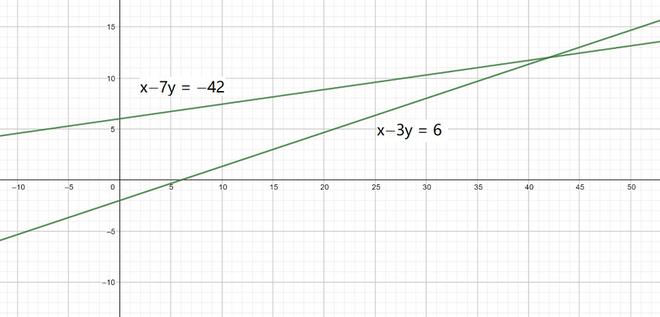
x−7y = −42 ………………………(I)
To draw the line for Eqn. (I), we need at least two solutions of the equation, So, we can use the following table to draw the graph:
x y 0 6 -42 0 And, According to the another given condition,
x+3 = 3(y+3)
x+3 = 3y+9
x−3y = 6 …………..…………………(II)
To draw the line for Eqn. (II), we need at least two solutions of the equation, So, we can use the following table to draw the graph:
x y 0 -2 6 0 The graphical representation of Eqn. (I) and Eqn. (II) is:
👁 Image
Solution:
The cost of a bat = ₹ x
And, the cost of a ball = ₹ y
Here, According to the Given condition,
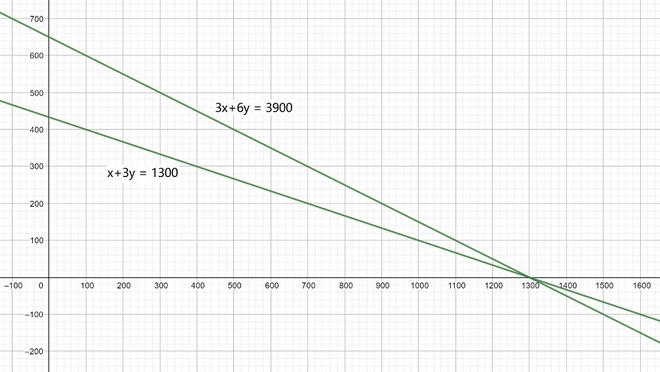
3x+6y = 3900 .........................(I)
x+3y = 1300 .........................(II)
To draw the line for Eqn. (I), we need at least two solutions of the equation, So, we can use the following table to draw the graph:
x y 0 650 1300 0 To draw the line for Eqn. (II), we need at least two solutions of the equation, So, we can use the following table to draw the graph:
x y 100 400 1300 0 The graphical representation of Eqn. (I) and Eqn. (II) is:
👁 Image
Solution:
The cost of 1 kg of apples = ₹ x
And, cost of 1 kg of grapes = ₹ y
Here, According to the given conditions,
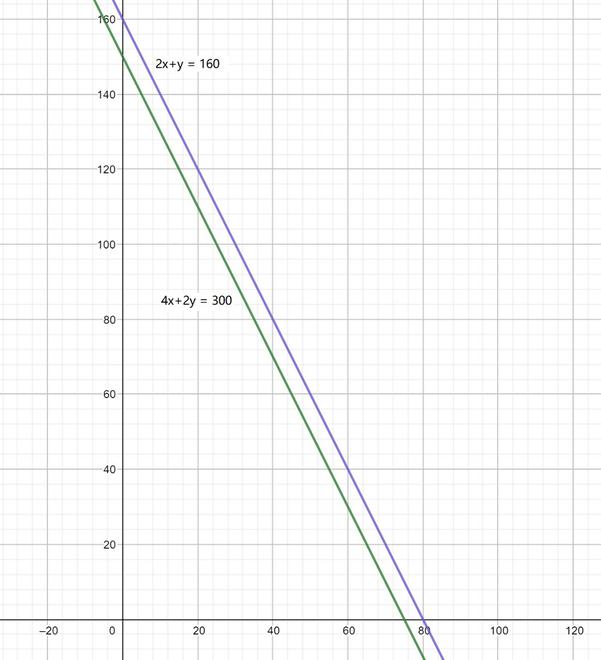
2x+y = 160 ...........................(I)
4x+2y = 300 ...........................(II)
To draw the line for Eqn. (I), we need at least two solutions of the equation, So, we can use the following table to draw the graph:
x y 0 160 80 0 To draw the line for Eqn. (II), we need at least two solutions of the equation, So, we can use the following table to draw the graph:
x y 0 150 75 0 The graphical representation of Eqn. (I) and Eqn. (II) is:
👁 Image
Exercise 3.1 of Chapter 3 (Pair of Linear Equations in Two Variables) in NCERT Class 10 Mathematics introduces the concept of linear equations in two variables and their graphical representation. It covers topics such as identifying linear equations, determining whether a given pair of equations forms a consistent or inconsistent system, and graphing linear equations. Students learn to plot linear equations on a coordinate plane, interpret the nature of their solutions based on the graphs, and understand the geometric significance of different types of solutions (one solution, no solution, or infinitely many solutions).