 |
VOOZH | about |
|
VOOZH | about |
Chapter 7 of RD Sharma's Class 10 textbook focuses on Statistics a branch of mathematics that deals with the collection, analysis, interpretation, and presentation of data. This chapter is crucial for understanding how to summarize and make sense of numerical data in various contexts. The aim is to equip students with the skills to apply statistical methods to real-world problems enhancing their data interpretation abilities.
Statistics involves methods for summarizing and analyzing data to extract meaningful insights. It includes descriptive statistics which summarize data sets through measures like mean, median, and mode, and inferential statistics which make predictions or inferences about a population based on the sample data. Organizing and analyzing data statistics helps in making informed decisions and understanding trends.
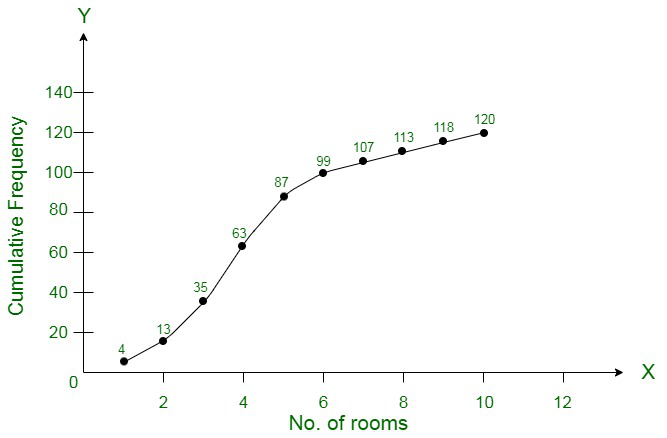
| No. of rooms | 1 | 2 | 3 | 4 | 5 | 6 | 7 | 8 | 9 | 10 |
| No. of houses | 4 | 9 | 22 | 28 | 24 | 12 | 8 | 6 | 5 | 2 |
Solution:
No. of rooms No. of houses Cumulative Frequency Less than or equal to 1 4 4 Less than or equal to 2 9 13 Less than or equal to 3 22 35 Less than or equal to 4 28 63 Less than or equal to 5 24 87 Less than or equal to 6 12 99 Less than or equal to 7 8 107 Less than or equal to 8 6 113 Less than or equal to 9 5 118 Less than or equal to 10 2 120 We plot the points (1, 4), (2, 13), (3, 35), (4, 63), (5, 87), (6, 99), (7, 107), (8, 113), (9, 118), (10, 120) respectively by taking the upper-class limit over the x-axis and cumulative frequency over the y-axis of the graph.
👁 Image
| Marks | No. of Students |
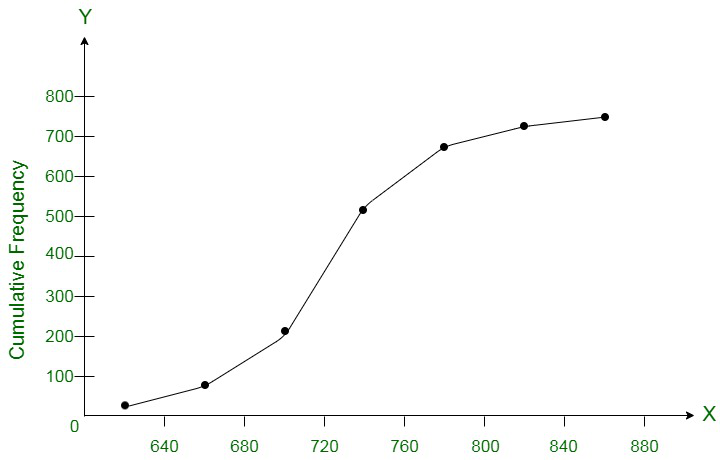
| 600 – 640 | 16 |
| 640 – 680 | 45 |
| 680 – 720 | 156 |
| 720 – 760 | 284 |
| 760 – 800 | 172 |
| 800 – 840 | 59 |
| 840 – 880 | 18 |
Solution:
👁 Image
Marks No. of Students Marks Less than Cumulative Frequency 600 – 640 16 640 16 640 – 680 45 680 61 680 – 720 156 720 217 720 – 760 284 760 501 760 – 800 172 800 673 800 – 840 59 840 732 840 – 880 18 880 750
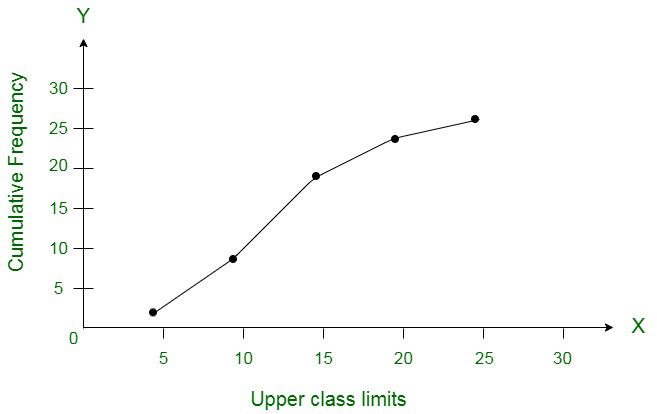
| Class-interval | 0 – 4 | 5 – 9 | 10 – 14 | 15 – 19 | 20 – 24 |
| No. of students | 2 | 6 | 10 | 5 | 3 |
Solution:
Converting the given frequency distribution into continuous frequency distribution:
Class-interval No. of Students Less than Cumulative frequency 0.5 – 4.5 2 4.5 2 4.5 – 9.5 6 9.5 8 9.5 – 14.5 10 14.5 18 14.5 – 19.5 5 19.5 23 19.5 – 24.5 3 24.5 26 We plot the specified points (4.5, 2), (9.5, 8), (14.5, 18), (19.5, 23), (24.5, 26) on a graph by taking the upper class limit over the x-axis and cumulative frequency over the y-axis respectively.
👁 Image
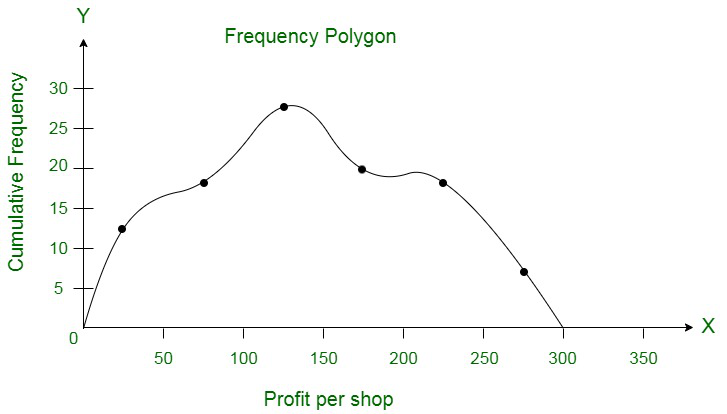
| Profit per shop | No of shops: |
| 0 – 50 | 12 |
| 50 – 100 | 18 |
| 100 – 150 | 27 |
| 150 – 200 | 20 |
| 200 – 250 | 17 |
| 250 – 300 | 6 |
Solution:
Now, computing the following data, we have,
Profit per shop Mid-value No of shops: Less than 0 0 0 Less than 0 – 50 25 12 Less than 50 – 100 75 18 Less than 100 – 150 125 27 Less than 150 – 200 175 20 Less than 200 – 250 225 17 Less than 250 – 300 275 6 Above 300 300 0 Now, the frequency polygon can be computed as follows :
👁 Image
| Daily income (in Rs): | No of workers: |
| 100 – 120 | 12 |
| 120 – 140 | 14 |
| 140 – 160 | 8 |
| 160 – 180 | 6 |
| 180 – 200 | 10 |
Solution:
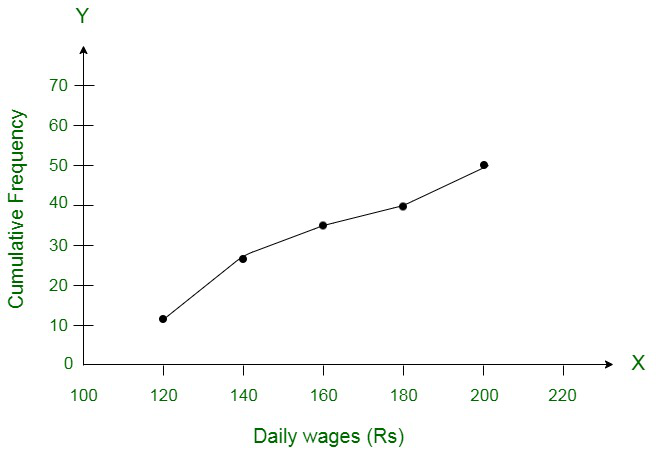
Using the less than method, the following distribution can be converted to a continuous distribution, as,
Daily income Cumulative frequency Less than 120 12 Less than 140 26 Less than 160 34 Less than 180 40 Less than 200 50 Mark the point (120, 12), (140, 26), (160, 34), (180, 40), (200, 50), taking upper class limit on the x-axis and cumulative frequencies on y-axis respectively.
👁 Image
| Production yield | 50-55 | 55-60 | 60-65 | 65-70 | 70-75 | 75-80 in kg per hectare |
| Number of farms | 2 | 8 | 12 | 24 | 38 | 16 |
Solution:
(i) Computing the Less than ogive
Production yield
in kg 1 hectare
Class No. of farms.
(f)
c.f. Less than 55 50-55 2 2 Less than 60 55-60 8 10 Less than 65 60-65 12 22 Less than 70 65-70 24 46 Less than 75 70-75 38 84 Less than 80 75-80 16 100
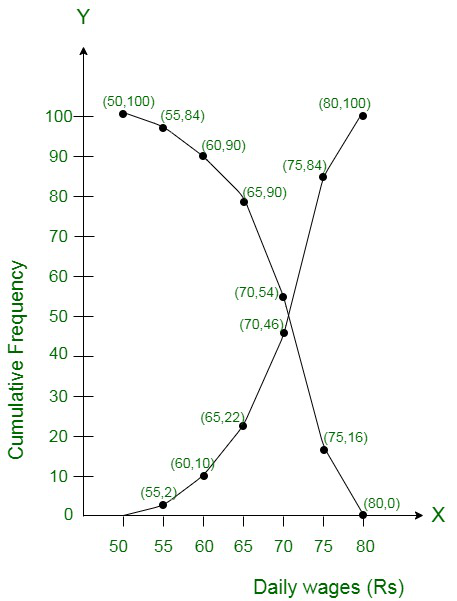
We plot the specified points (55, 2), (60, 10), (65, 22), (70, 46), (75, 84) and (80, 100) and connect them to form an ogive.(ii) More than
Production yield c.f. Class More than or equal to 50 100 50-55 More than or equal to 55 84 55-60 More than or equal to 60 46 60-65 More than or equal to 65 22 65-70 More than or equal to 70 10 70-75 More than or equal to 75 2 75-80 More than or equal to 80 0 80-85 We plot the specified points (50, 100), (55, 84), (60, 46), (65, 22), (70, 10), (75, 2) and (80, 0) and connect to form a more than ogive as shown below:
👁 Image
Weight (in Kg) | Number of students |
Less than 38 | 0 |
Less than 40 | 3 |
Less than 42 | 5 |
Less than 44 | 9 |
Less than 46 | 14 |
Less than 48 | 28 |
Less than 50 | 32 |
Less than 52 | 35 |
Solution:
👁 Image
Weight (in Kg)
Number of students
Class c.f. Less than 38
0
36-38 0 Less than 40
3
38-40 3 Less than 42
5
40-42 2 Less than 44
9
42-44 4 Less than 46
14
44-46 5 Less than 48
28
46-48 14 Less than 50
32
48-50 4 Less than 52
35
50-52 3
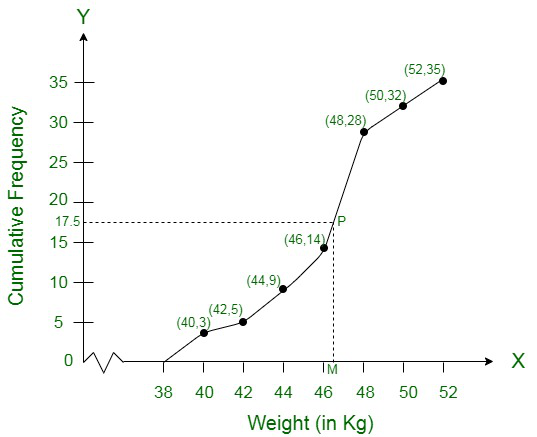
Plot the points (38, 0), (40, 3), (42, 5), (44, 9), (46, 14), (48, 28), (50, 32), (52, 35) on the graph and join them in free hand to get an ogive as shown.Here N = 35 which is odd
∴ = 252 = 17.5
From 17.5 on y-axis draw a line parallel to x-axis meeting the curve at P. From P, draw PM ⊥ x-axis
∴ Median which is 46.5 (approx)
Now N = 17.5 lies in the class 46 – 48 (as 14 < 17.5 < 28)
∴ 46-48 is the median class
Here l= 46, h = 2,f= 14, F= 14
∴ Median =
Rainfall (in cm): | 0-10 | 10-20 | 20-30 | 30-40 | 40-50 | 50-60 |
Number of days: | 22 | 10 | 8 | 15 | 5 | 6 |
Solution:
We observe that, the annual rainfall record of a city less than 0 is 0. Similarly, less than 10 include the annual rainfall record of a city from 0 as well as the annual rainfall record of a city from 0-10. So,
the total annual rainfall record of a city for less than 10 cm is 0 + 22 = 22 days. Continuing in this manner, we will get remaining less than 20, 30, 40, 50 and 60.Also, we observe that annual rainfall
record of a city for 66 days is more than or equal to 0 cm. Since, 22 days lies in the interval 0-10. So, annual rainfall record for 66 – 22 = 44 days is more than or equal to 10 cm. Continuing in this
manner we will get remaining more than or equal to 20, 30 , 40, 50, and 60.
Now, we construct a table for less than and more than type.
(i) Less than type
(ii) More than type
Rainfall (in cm)
Number of days
Rainfall (in cm)
Number of days
Less than 0
0
More than or equal to 0
66
Less than 10
0+22=22
More than or equal to 10
66-22=44
Less than 20
22+10=32
More than or equal to 20
44-10=34
Less than 30
32+8=40
More than or equal to 30
34-8=26
Less than 40
40+15=55
More than or equal to 40
26-15=11
Less than 50
55+5=60
More than or equal to 50
11-5=6
Less than 60
60+6=66
More than or equal to 60
6-6=0
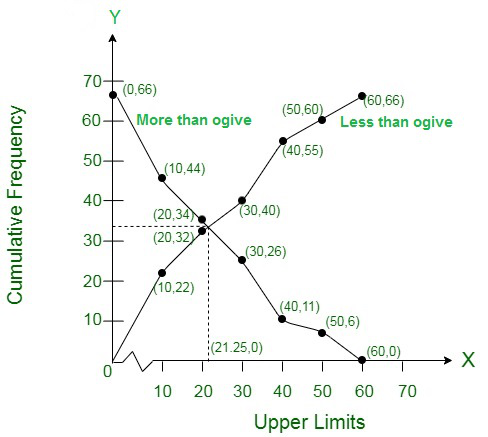
To draw less than type ogive we plot the points (0,0), (10,22), (20,32), (30, 40), (40, 55), (50, 60), (60, 66) on the paper and join them by free hand.To draw the more than type ogive we plot the points (0, 66), (10, 44), (20, 34), (30, 26), (40, 11), (50, 6) and (60, 0) on the graph paper and join them by free hand.
👁 Image∵ Total number of days (n) = 66
Now, = 33
Firstly, we plot a line parallel to X-axis at intersection point of both ogives, which further intersect at (0, 33) on Y- axis. Now, we draw a line perpendicular to X-axis at intersection point of both ogives,
which further intersect at (21.25, 0) on X-axis. Which is the required median using ogives.
Hence, median rainfall = 21.25 cm.
Height | Number of trees |
Less than 7 | 26 |
Less than 14 | 57 |
Less than 21 | 92 |
Less than 28 | 134 |
Less than 35 | 216 |
Less than 42 | 287 |
Less than 49 | 341 |
Less than 56 | 360 |
Solution:
(i) First we prepare less than frequency table as given below:
👁 Image
Height
Class interval
Frequency
c.f.
Less than 7
0-7
26
26
Less than 14
7-14
31
57
Less than 21
14-21
35
92
Less than 28
21-28
42
134
Less than 35
28-35
82
216
Less than 42
35-42
71
287
Less than 49
42-49
54
341
Less than 56
49-56
19
360
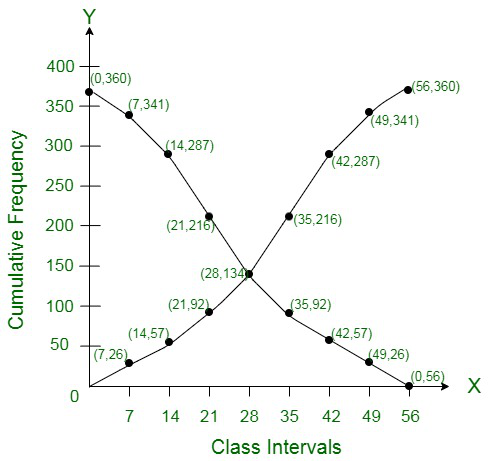
Now we plot the points (7, 26), (14, 57), (21, 92), (28, 134), (35, 216), (42, 287), (49, 341), (56, 360) on the graph and join then in a frequency curve which is ‘less than ogive’
(ii) More than ogive:
First we prepare ‘more than’ frequency table as shown given below:
More than
Class interval
c.f.
Frequency
More than 0
0-7
360
19
More than 7
7-14
341
54
More than 14
14-21
287
71
More than 21
21-28
216
82
More than 28
28-35
134
42
More than 35
35-42
92
35
More than 42
42-49
57
31
More than 49
49-56
26
26
More than 56
56-
0
0
Now we plot the points (0, 360), (7, 341), (14, 287), (21, 216), (28, 134), (35, 92), (42, 57), (49, 26), (56, 0) on the graph and join them in free hand curve to get more than ogive.
Profit (in lakhs ₹) | Class intervals | Number of shops (c.f.) | Frequency |
More than or equal to 5 | 5-10 | 30 | 2 |
More than or equal to 10 | 10-15 | 28 | 12 |
More than or equal to 15 | 15-20 | 16 | 2 |
More than or equal to 20 | 20-25 | 14 | 4 |
More than or equal to 25 | 25-30 | 10 | 3 |
More than or equal to 30 | 30-35 | 7 | 4 |
More than or equal to 35 | 35-40 | 3 | 0 |
Draw both ogives for the above data and hence obtain the median.
Solution:
Class interval
Frequency
c.f.
5-10
3
3
10-15
4
7
15-20
3
10
20-25
4
14
25-30
2
16
30-35
12
28
35-40
2
30
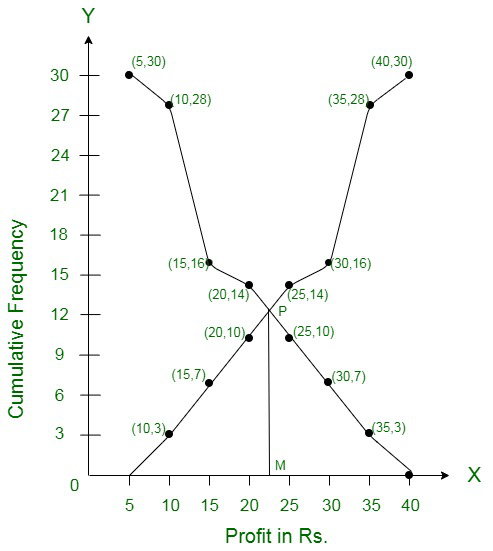
Now plot the points (5, 30), (10, 28), (15, 16), (20, 14), (25, 10), (30, 7) and (35, 3) on the graph and join them to get a more than curve.Less than curve:
👁 Image
Now plot the points (10, 3), (15, 7), (20, 10), (25, 14), (30, 16), (35, 28) and (40, 30) on the graph and join them to get a less them ogive. The two curved intersect at P. From P, draw PM 1 x-axis, M is themedian which is 22.5
∴ Median = Rs. 22.5 lakh