 |
VOOZH | about |
|
VOOZH | about |
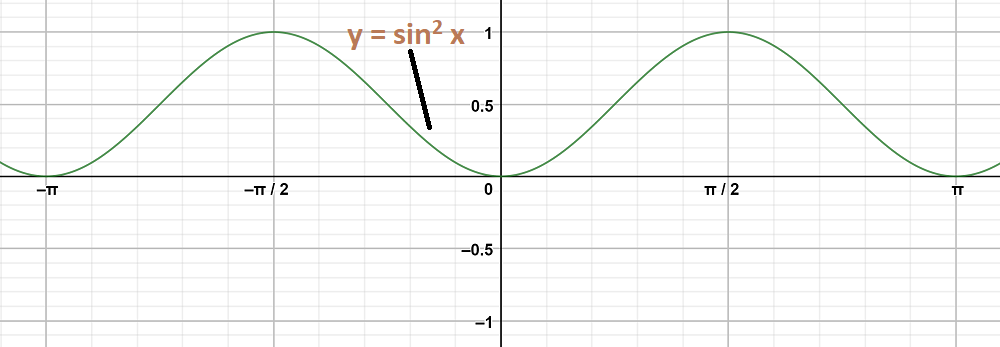
Solution:
As we know that,
y = sin2 x =
On shifting the origin at (0, 1/2), we get
X = x and Y =
On substituting these values, we get
The maximum and minimum values of Y are and respectively and shift it by 1/2 to the up.
As the equation in the form of y = - f(x), the graph become inverted of y = f(x)
👁 Image
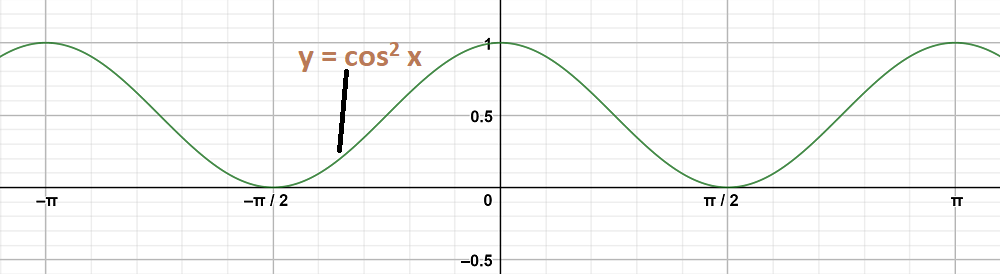
Solution:
As we know that,
y = cos2 x =
On shifting the origin at , we get
X = x and Y =
On substituting these values, we get
The maximum and minimum values of Y are and respectively and shift it by 1/2 to the up.
👁 Image
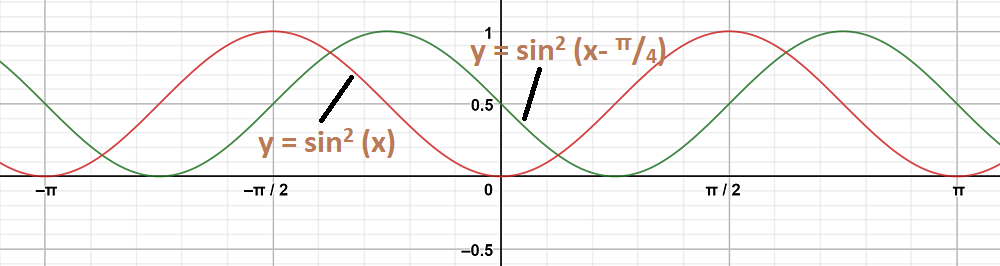
Solution:
To obtain this graph y-0 = sin2
On shifting the origin at (,0), we get
X = and Y = y – 0
On substituting these values, we get
Y = sin2 X
First we draw the graph of Y = sin2 X and shift it by π/4 to the right.
👁 Image
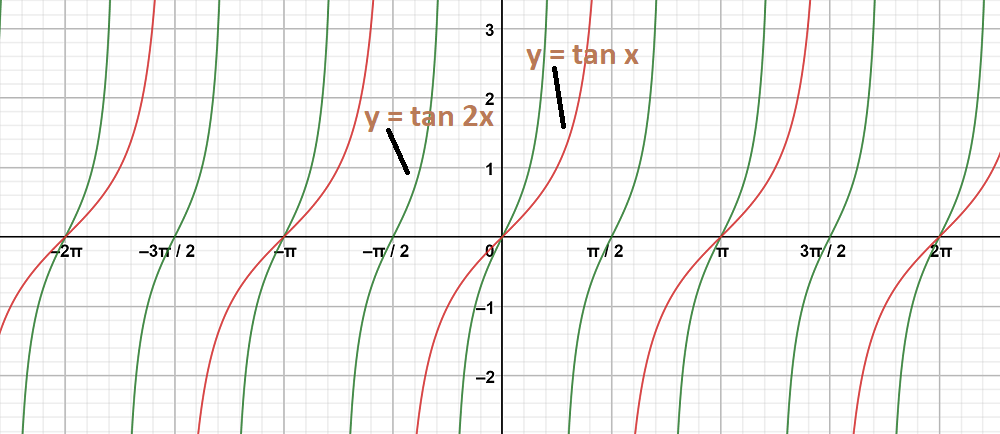
Solution:
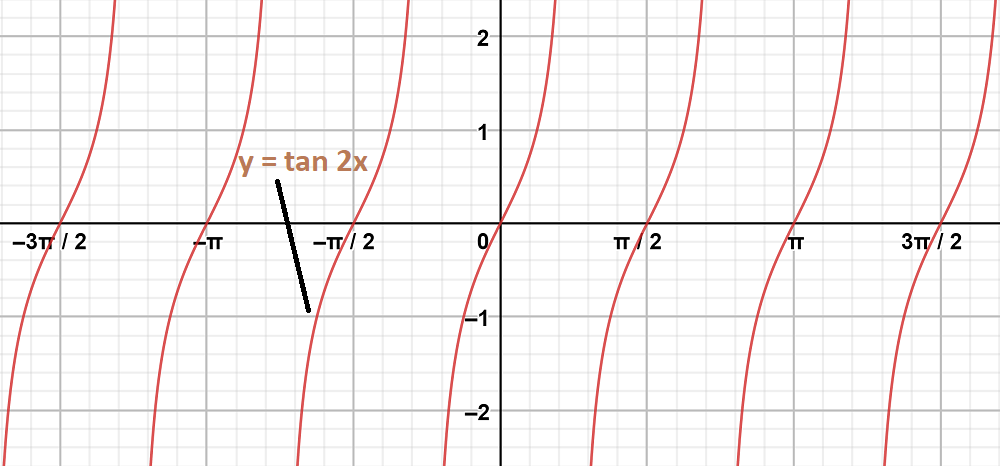
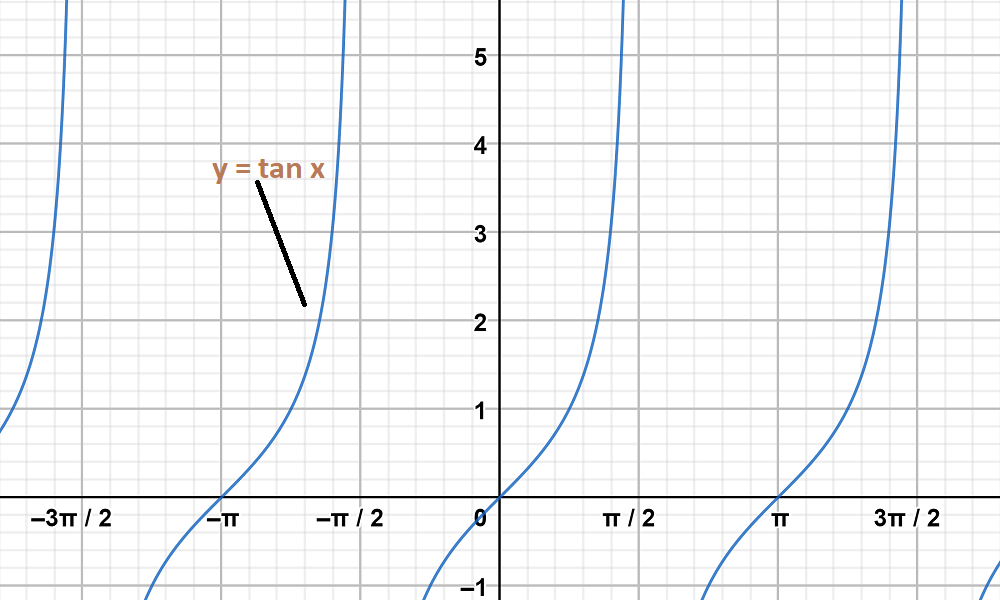
To obtain this graph y = tan 2x,
First we draw the graph of y = tan x and then divide the x-coordinates of the points where it crosses x-axis by 2.
👁 Image
Solution:
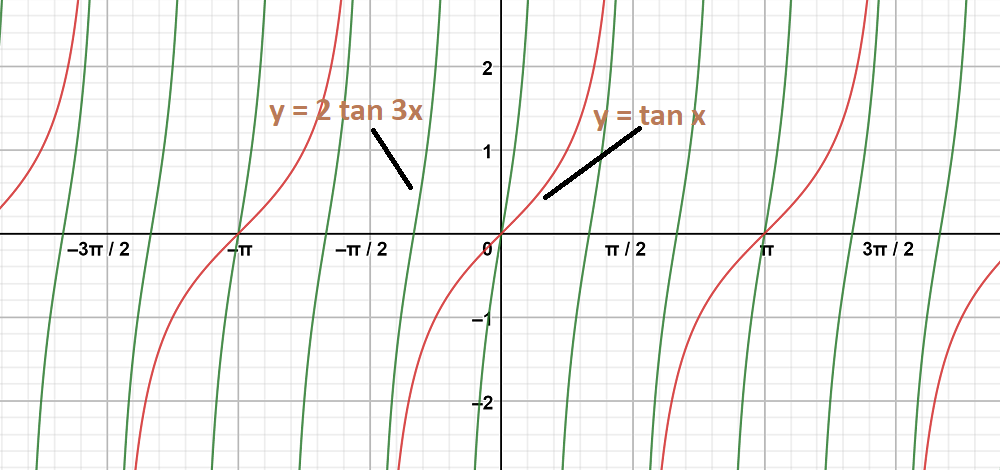
To obtain this graph y = 2 tan 3x,
First we draw the graph of y = tan x and then divide the x-coordinates of the points where it crosses x-axis by 3.
Stretch the graph vertically by the factor of 2.
👁 Image
Solution:
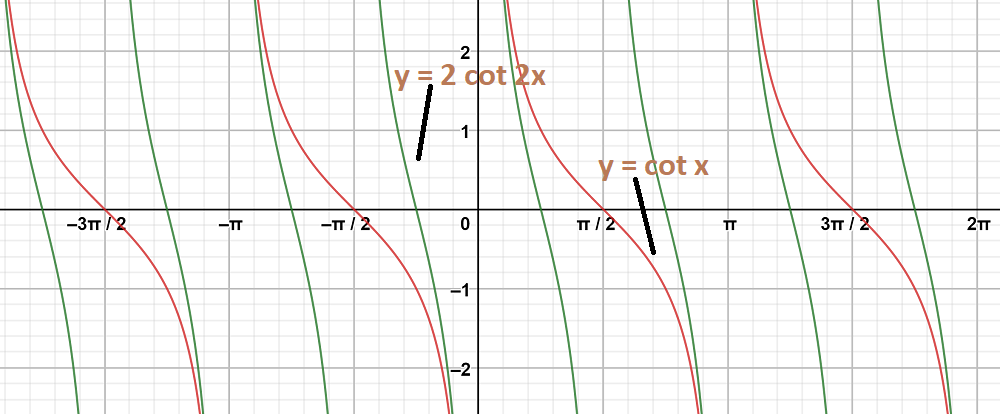
To obtain this graph y = 2 cot 2x,
First we draw the graph of y = cot x and then divide the x-coordinates of the points where it crosses x-axis by 2.
Stretch the graph vertically by the factor of 2.
👁 Image
Solution:
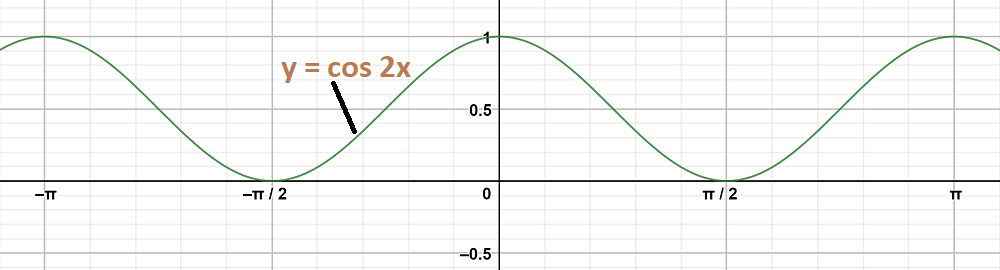
Graph 1:
y = cos2 x
As we know that,
y = cos2 x =
On shifting the origin at (0, 1/2), we get
X = x and Y =
On substituting these values, we get
The maximum and minimum values of Y are and respectively and shift it by 1/2 to the up.
👁 Image
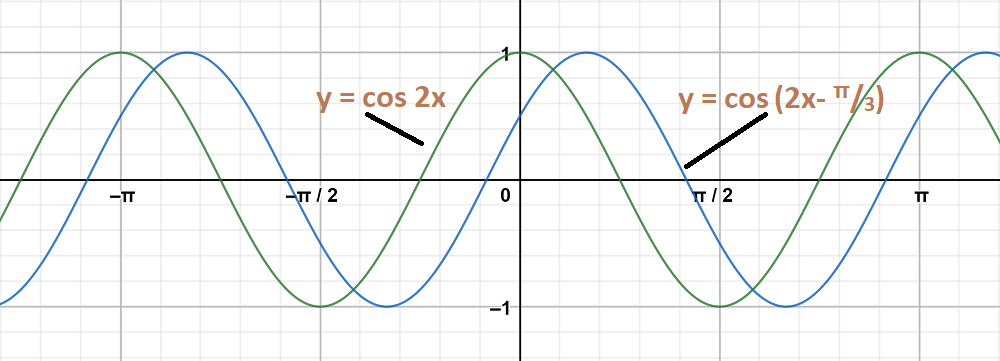
Graph 2:
To obtain this graph y-0 = cos (2x-) = cos 2(x-)
On shifting the origin at (π/6, 0), we get
X = and Y = y - 0
On substituting these values, we get
Y = cos 2X
First we draw the graph of Y = cos 2X and shift it by π/6 to the right.
👁 Image
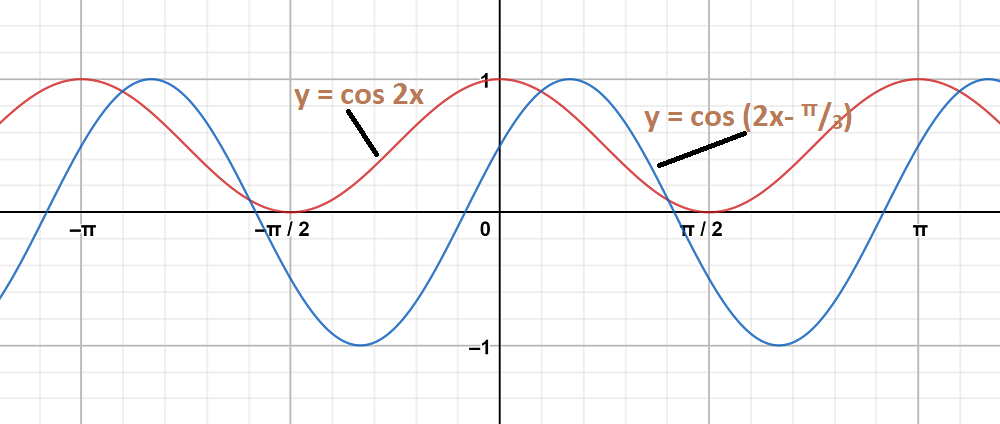
The graph y = cos2 x and y = cos are on same axes are as follows:
👁 Image
Solution:
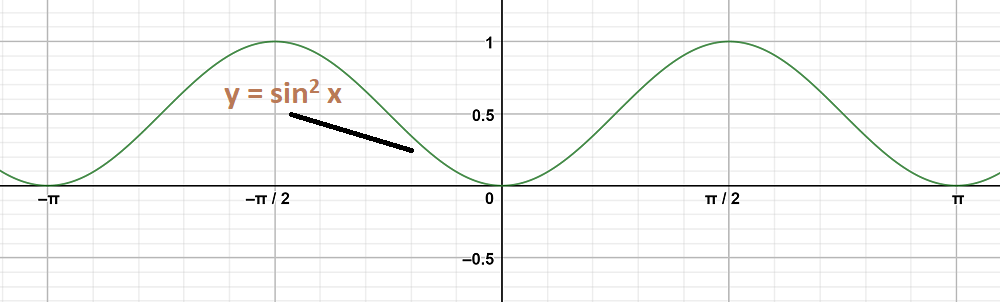
Graph 1:
y = sin2 x
As we know that,
y = sin2 x =
On shifting the origin at (0, ), we get
X = x and Y =
On substituting these values, we get
The maximum and minimum values of Y are and respectively and shift it by 1/2 to the up.
As the equation in the form of y = - f(x), the graph become inverted of y = f(x)
👁 Image
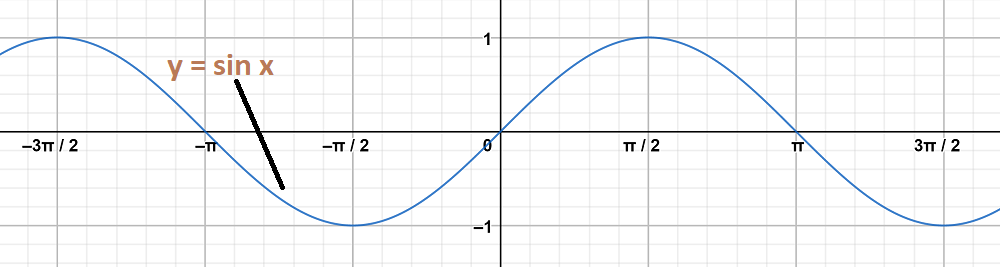
Graph 2:
y = sin x
👁 Image
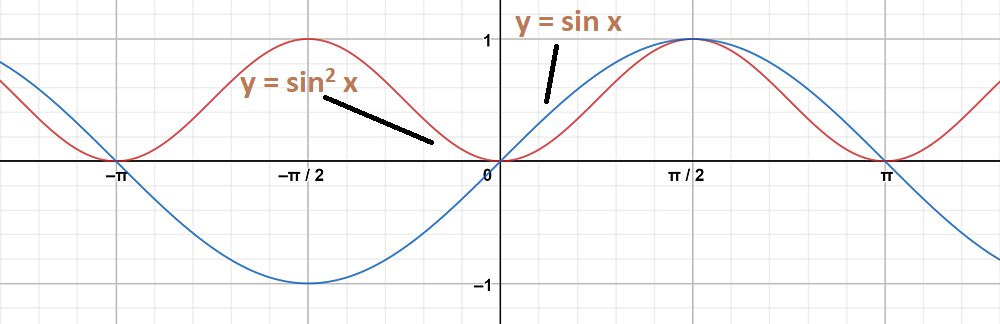
The graph y = sin2 x and y = sin x are on same axes are as follows:
👁 Image
Solution:
Graph 1:
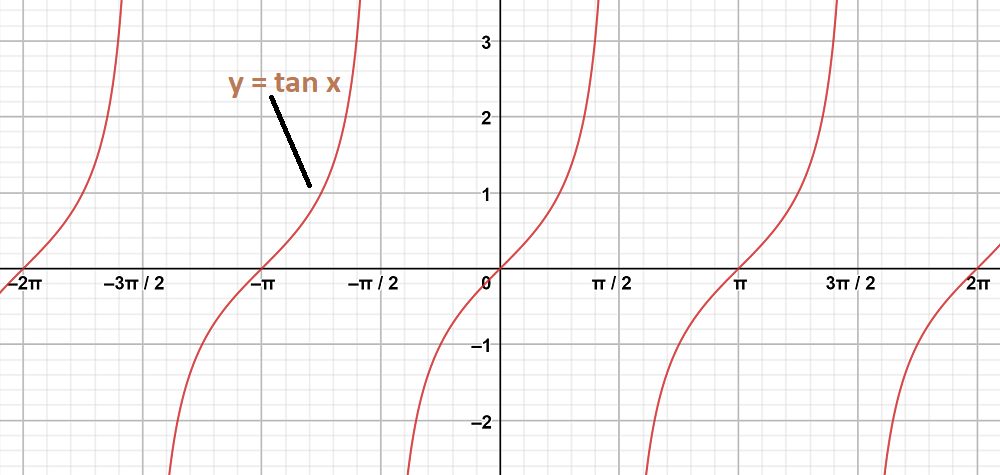
y = tan x
👁 Image
Graph 2:
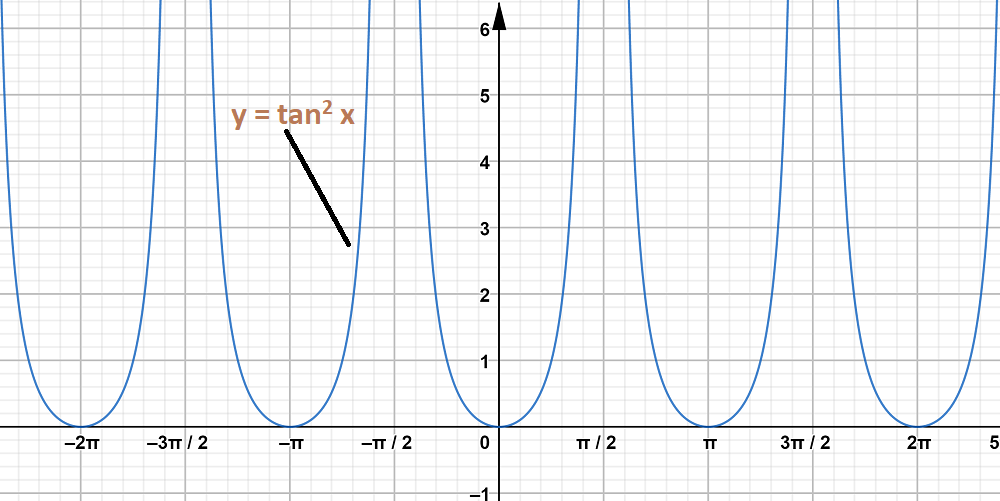
y = tan2 x
👁 Image
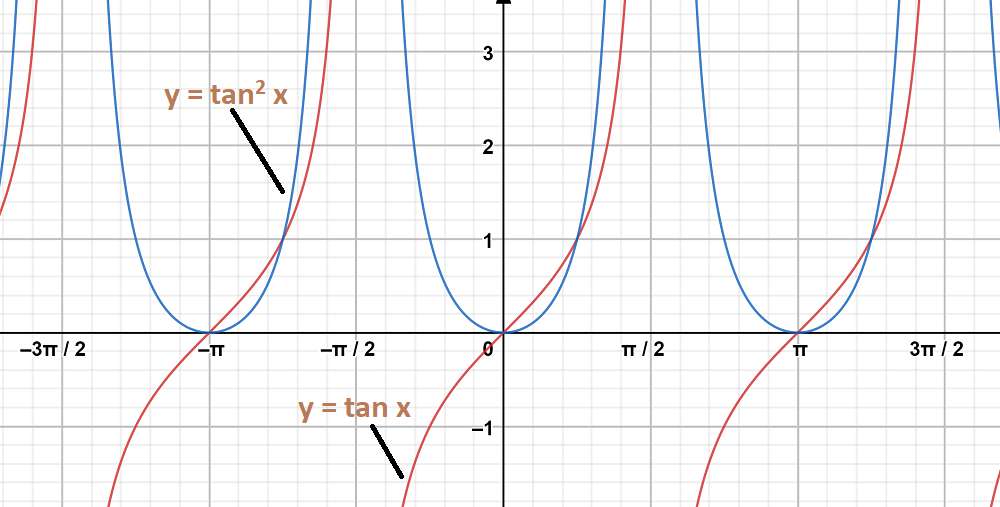
The graph y = tan x and y = tan2 x are on same axes are as follows:
👁 Image
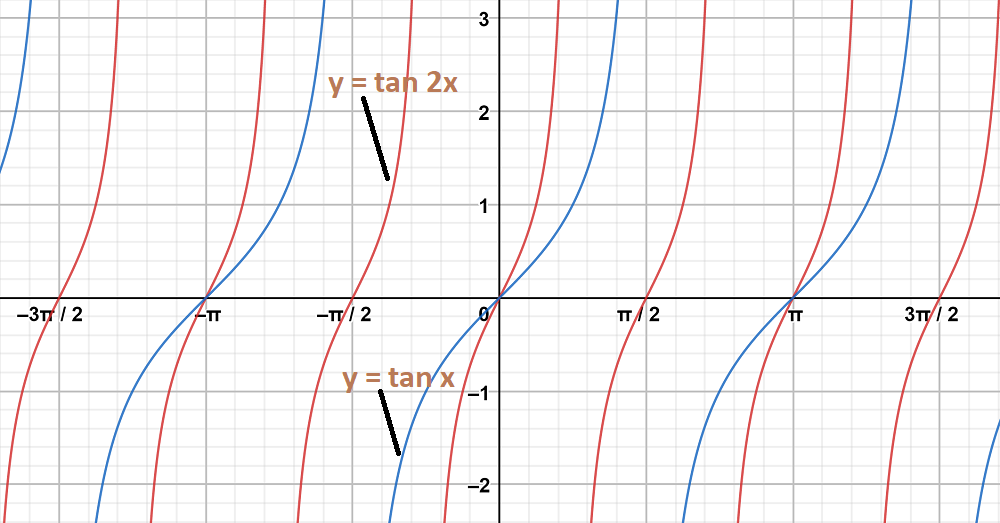
Solution:
Graph 1:
To obtain this graph y = tan 2x,
First we draw the graph of y = tan x and then divide the x-coordinates of the points where it crosses x-axis by 2.
👁 Image
Graph 2:
y = tan x
👁 Image
The graph y = tan 2x and y = tan x are on same axes are as follows:
👁 Image