 |
VOOZH | about |
|
VOOZH | about |
(a) The number of letters for different areas in a postman’s bag.
(b) The height of competitors in an athletics meet.
(c) The number of cassettes produced by 5 companies.
(d) The number of passengers boarding trains from 7:00 a.m. to 7:00 p.m. at a station.
Give reasons for each.
Solution:
(b) The height of competitors in an athletics meet.
(d) The number of passengers boarding trains from 7:00 a.m. to 7:00 p.m. at a station.
Reason:
Histogram is a graphical representation of data when the data is represented using the class-interval, where class-interval is the numerical width of any class.
As the cases mentioned in the options (b) and (d) data can be divided into class-intervals, therefore histogram can be used for representing the data.
Whereas in the cases (a) and (c) the data can’t be divided into class-intervals, thus histogram can’t be used for representing the data.
W W W G B W W M G G M M W W W W G B M W B G G M W W M M W W
W M W B W G M W W W W G W M M W W M W G W M G W M M B G G W
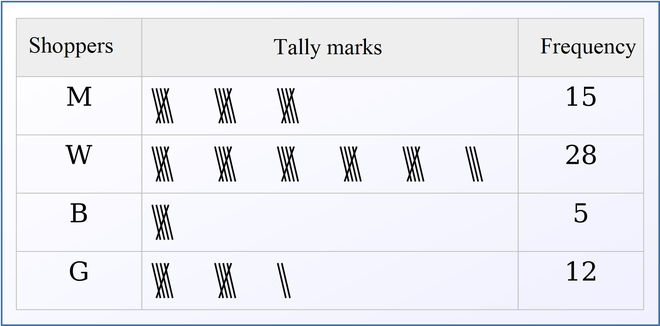
Make a frequency distribution table using tally marks. Draw a bar graph to illustrate it.
Solution:
Frequency distribution table using tally marks:
👁 Frequency distribution table
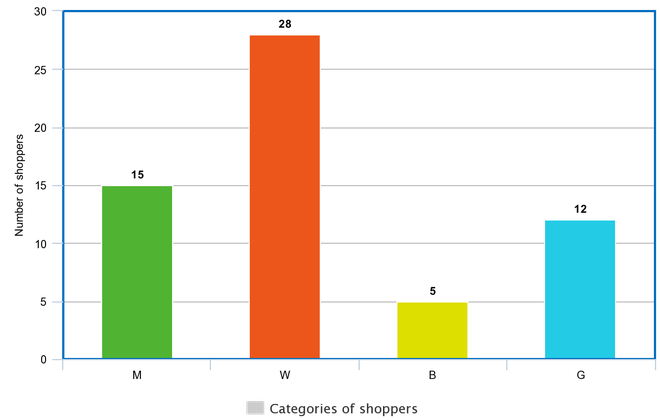
The bar graph to illustrate data:
👁 Bar graph
830, 835, 890, 810, 835, 836, 869, 845, 898, 890, 820, 860, 832, 833, 855, 845,
804, 808, 812, 840, 885, 835, 835, 836, 878, 840, 868, 890, 806, 840
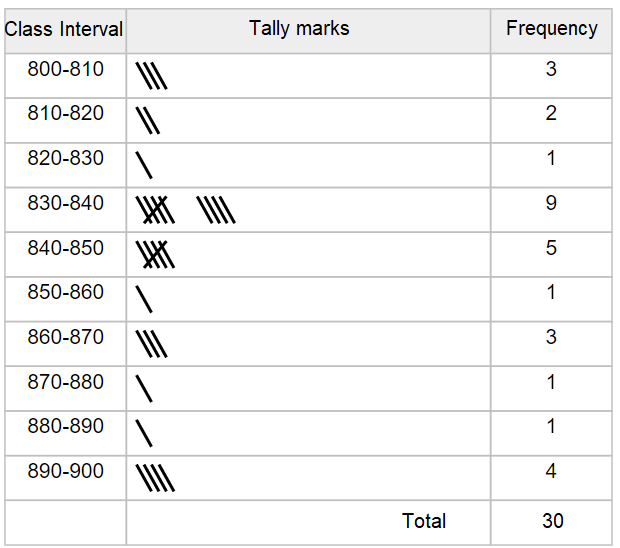
Using tally marks make a frequency table with intervals as 800–810, 810–820 and so on.
Solution:
Frequency table with intervals as 800–810, 810–820 and so on using tally marks are given below:
👁 Image
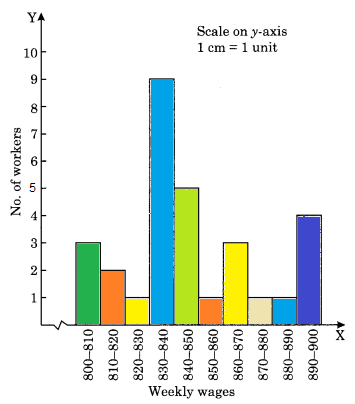
(i) Which group has the maximum number of workers?
(ii) How many workers earn ₹850 and more?
(iii) How many workers earn less than ₹ 850?
Solution:
👁 Image
(i) Group 830-840 has the maximum number of workers working, i.e., 9.
Reason: When seeing the graph we can observe that group having weekly wage 830-840 there are 9 workers working.
(ii) 10 workers earn more than or equal to ₹ 850.
Reason: When seeing the graph we can observe that group having weekly wage more than or equal to ₹ 850, there are 10 workers working when we add all the workers having wage more than or equal to ₹ 850.
(iii) 20 workers earn less than ₹ 850.
Reason: When seeing the graph we can observe that group having weekly wage less than ₹ 850, there are 20 workers working when we add all the workers having wage less than ₹ 850.
Answer the following:
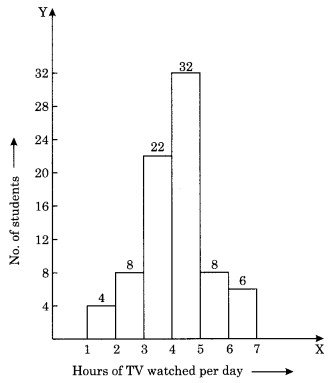
(i) For how many hours did the maximum number of students watch TV?
(ii) How many students watched TV for less than 4 hours?
(iii) How many students spent more than 5 hours in watching TV?
👁 ImageSolution:
(i) By observing the graph we can find that the maximum number of students i.e. 32 watched TV for 4 to 5 hours.
(ii) The students who watched TV for less than 4 hours are 34 students.
Reason:
Students who watch TV for 1-2 hours : 4
Students who watch TV for 2-3 hours : 8
Students who watch TV for 3-4 hours : 22
Therefore, the student who watched TV for less than 4 hours are 4+8+22 = 34
(iii) The students who watched TV for more than 5 hours are 14 students.
Reason:
Students who watch TV for 6-6 hours : 8
Students who watch TV for 6-7 hours : 6
Therefore the student who watched TV for more than 5 hours are 8+6 = 14