 |
VOOZH | about |
|
VOOZH | about |
In Chapter 4 of Class 9 NCERT Mathematics, students learn about linear equations in the two variables and their graphical representation. Exercise 4.3 focuses on solving linear equations plotting their graphs and understanding the relationship between the variables. These concepts lay the foundation for understanding more advanced algebraic and geometric methods in the higher classes.
A linear equation in two variables is an equation that can be written in the form:
ax+by+c=0
where x and y are the variables and a,b, and c are constants. The solutions to this equation are the ordered pairs (x,y) that satisfy the equation. Graphically, the solutions represent a straight line on a coordinate plane. Each point on the line corresponds to the solution of the equation.
(i) x + y = 4
(ii) x – y = 2
(iii) y = 3x
(iv) 3 = 2x + y
Solution:
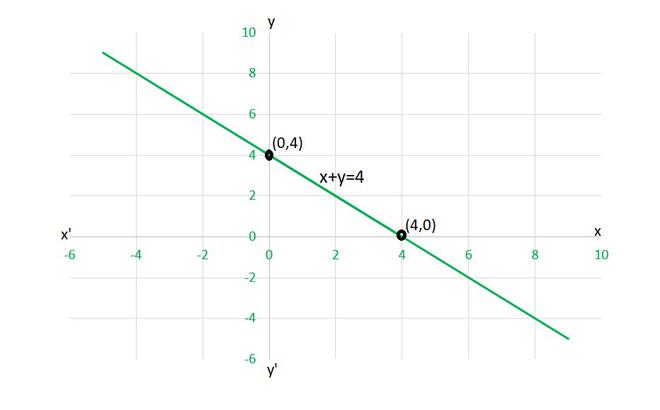
(i) To draw the graph x+y=4, we need at least two solutions of the equation.
We can check that when, x = 0, y = 4,
and x = 4, y = 0
are solutions of the given equation. So, we can use the following table to draw the graph:
👁 Image
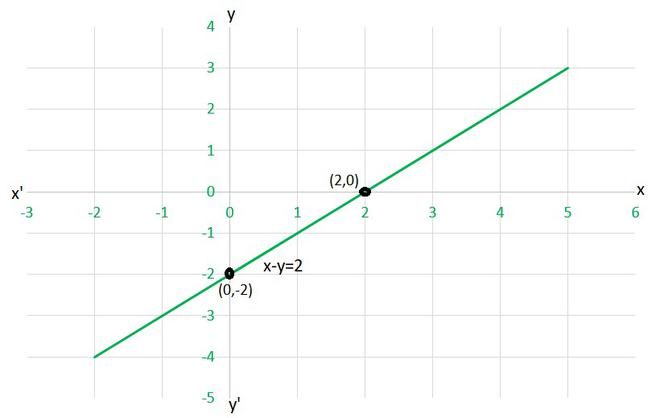
x y 0 4 4 0 (ii) To draw the graph x-y=2, we need at least two solutions of the equation.
We can check that when, x = 0, y = -2,
and x = 2, y = 0
are solutions of the given equation. So, we can use the following table to draw the graph:
👁 Image
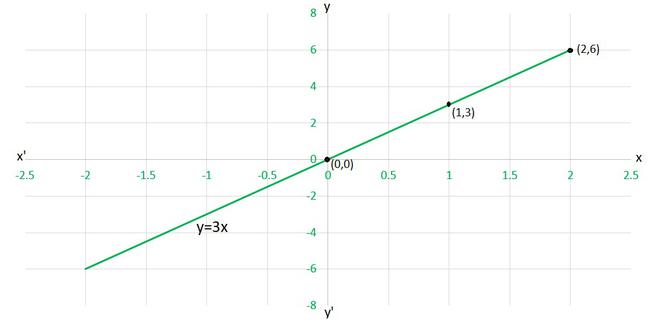
x y 0 -2 2 0 (iii) To draw the graph y=3x, we need at least two solutions of the equation.
We can check that when, x = 0, y =0,
and x = 1, y = 3
are solutions of the given equation. So, we can use the following table to draw the graph :
👁 Image
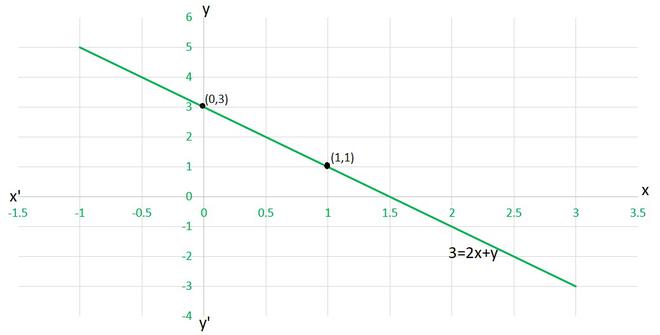
x y 0 0 1 3 (iv) To draw the graph 3=2x+y, we need at least two solutions of the equation.
We can check that when, x = 0, y =3,
and x = 1, y = 1
are solutions of the given equation. So, we can use the following table to draw the graph :
👁 Image
x y 0 3 1 1
Solution:
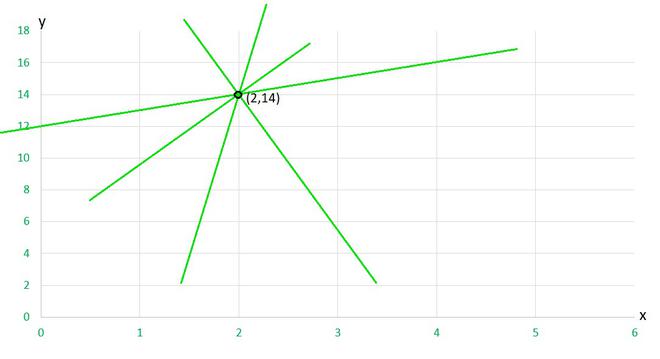
Here, as given point is (2,14) so
x=2 and y=14
We can form various equation such as,
y-x = 14-2 = 12
x+y = 2+14 =16
2x+y = 4+14 = 18
y-2x = 14-4 = 10
y = 14
x = 2
and many more........
In fact, there are infinitely many linear equations which are satisfied by the coordinates of the point (2, 14).
As it is stated that there can be infinite lines passing through a point. So here,
⟹
👁 Image
Solution:
The given equation is
3y = ax+7
According to the given point (3,4),
x = 3 and y = 4
As this point lie on this graph, then it will satisfy these points. So substituting the values
3y = ax+7
⟹ (3×4) = (a×3)+7
12 = 3a+7
3a = 12–7
3a = 5
a =
Hence, the value of a = .
Solution:
So, as given in the question, we will take
Distance covered as x km
and total fare as ₹ y
Fare for the first kilometer = 8 per km
Fare after the first 1km = ₹ 5 per km
Let x is the total distance, then the distance after one km will be = (x-1)km
Hence., Fare after the first km = 5(x-1)
So, in equation form we can conclude that,
The total fare = Fare of first km+ fare after the first km
y = 8+5(x-1)
y = 8+5(x-1)
y = 8+5x – 5
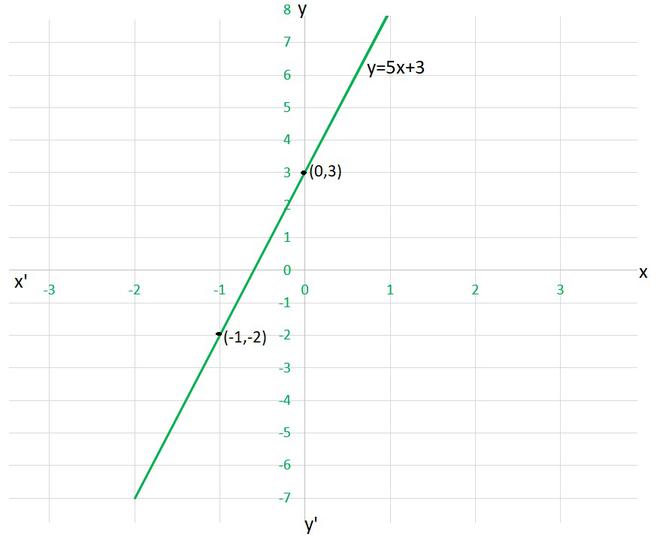
y = 5x+3
To draw the graph y=5x+3, we need at least two solutions of the equation.
We can check that when, x = 0, y =3,
and x = -1, y = -2
are solutions of the given equation. So, we can use the following table to draw the graph :
👁 Image
x y 0 3 -1 -2
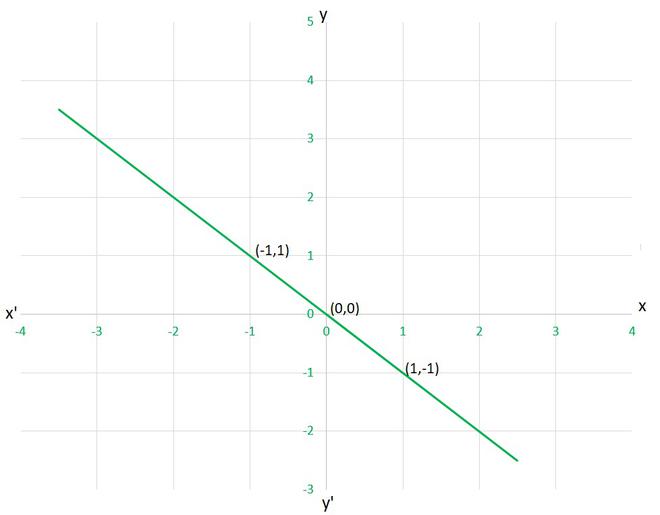
For Fig. 4. 6
👁 Image(i) y = x
(ii) x + y = 0
(iii) y = 2x
(iv) 2 + 3y = 7x
Solution:
Let's check each given cases, whether they are satisfying the solution given on graph or not,
(i) y=x
as given point (1,-1)
x=1 and y=-1 ⟹ x≠y
Hence, this equation is INCORRECT for this graph.
(ii) x+y=0
as given point (1,-1), (1,-1) and (0,0)
x=1 and y=-1 ⟹ x+y=0
x=-1 and y=1 ⟹ x+y=0
x=0 and y=0 ⟹ x+y=0
Hence, this equation is CORRECT for this graph.
(iii) y=2x
as given point (1,-1)
x=1 and y=-1 ⟹ y≠2x
Hence, this equation is INCORRECT for this graph.
(iii) 2+3y=7x
as given point (1,-1)
x=1 and y=-1 ⟹ 2+3y≠7x
Hence, this equation is INCORRECT for this graph.
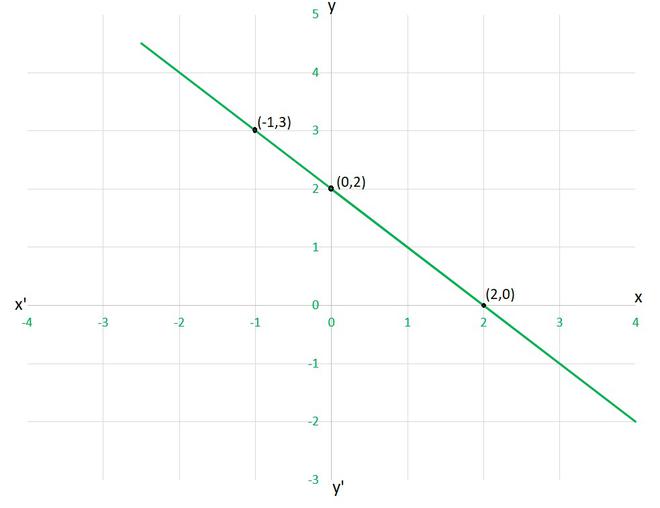
For Fig. 4.7
👁 Image(i) y = x + 2
(ii) y = x – 2
(iii) y = –x + 2
(iv) x + 2y = 6
Solution:
Let's check each given cases, whether they are satisfying the solution given on graph or not,
(i) y=x+2
as given point (0,2), (2,0) and (-1,3)
x=0 and y=2 ⟹ y=x+2
x=2 and y=0 ⟹ y≠x+2
Hence, this equation is INCORRECT for this graph.
(ii) y=x-2
as given point (0,2)
x=0 and y=2 ⟹ y≠x-2
Hence, this equation is INCORRECT for this graph.
(iii) y=-x+2
as given point (0,2)
x=0 and y=2 ⟹ y=-x+2
x=2 and y=0 ⟹ y=-x+2
x=-1 and y=3 ⟹ y=-x+2
Hence, this equation is CORRECT for this graph.
(iii) x+2y=6
as given point (0,2)
x=0 and y=2 ⟹ x+2y≠6
Hence, this equation is INCORRECT for this graph.
(i) 2 units
(ii) 0 unit
Solution:
Given in question,
Work done = force × displacement
where constant force = 5 units
lets take work done as y units
and, distance travelled by the body x units
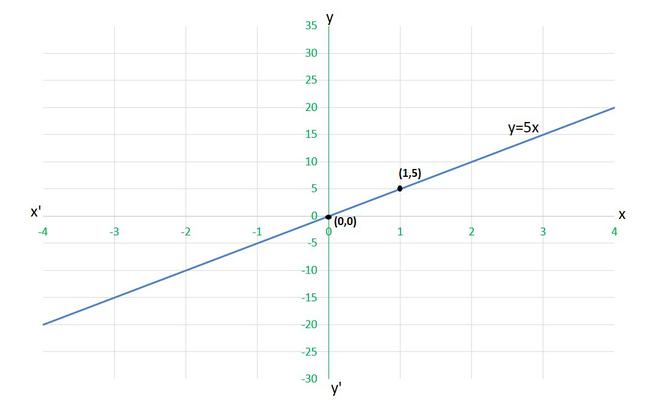
Hence, the equation can be expressed as,
y=5x
To draw the graph y=5x, we need at least two solutions of the equation.
We can check that when, x = 0, y =0,
and x = 1, y = 5
are solutions of the given equation. So, we can use the following table to draw the graph :
👁 Image
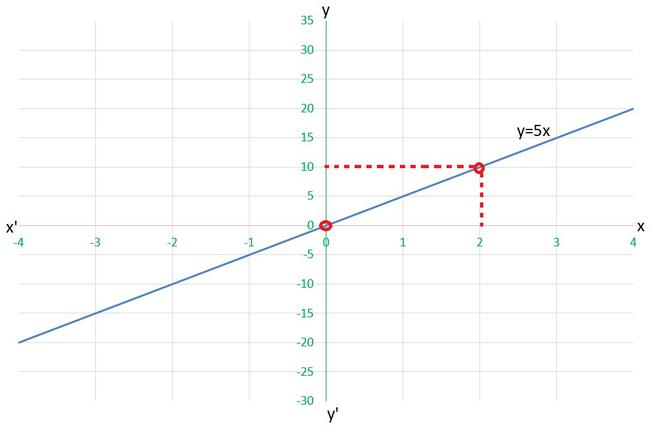
x y 0 0 1 5 (i) for x= 2 units
y=5×2
work done = 10 units
(ii) for x= 0 units
y=5×0
work done = 0 units
👁 Image
Solution:
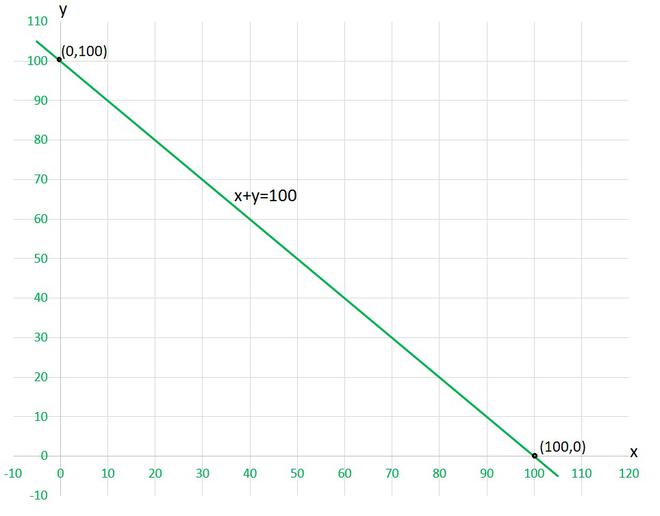
Let's take Yamini's contribution as ₹ x and Fatima's contribution as ₹ y.
As they together contributed ₹ 100, so the equation can be formed as,
x+y=100
To draw the graph x+y=100, we need at least two solutions of the equation.
We can check that when, x = 0, y =100,
and x = 100, y = 0
are solutions of the given equation. So, we can use the following table to draw the graph :
👁 Image
x y 0 100 100 0
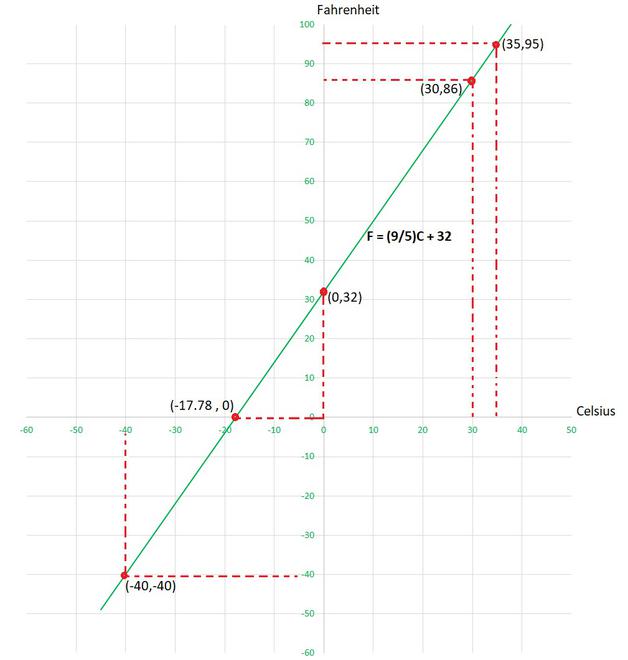
F = C + 32
(i) Draw the graph of the linear equation above using Celsius for x-axis and Fahrenheit for y-axis.
(ii) If the temperature is 30°C, what is the temperature in Fahrenheit?
(iii) If the temperature is 95°F, what is the temperature in Celsius?
(iv) If the temperature is 0°C, what is the temperature in Fahrenheit and if the temperature is 0°F, what is the temperature in Celsius?
(v) Is there a temperature which is numerically the same in both Fahrenheit and Celsius? If yes, find it.
Solution:
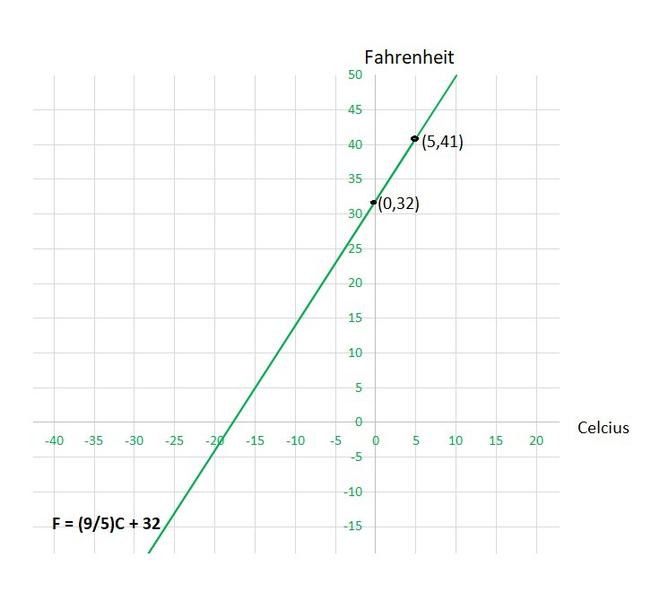
(i) Taking Celsius on x-axis and Fahrenheit on y-axis , so equation will be as follows:
y = x + 32
To draw the graph y = x + 32, we need at least two solutions of the equation.
We can check that when, x = 0, y =32,
and x = 5, y = 41
are solutions of the given equation. So, we can use the following table to draw the graph :
👁 Image
x y 0 32 5 41 (ii) When the temperature is 30°C then, using the equation
y = x + 32
by substituting, x=30, we get
y = ×30 + 32
y = 86
Hence, in Fahrenheit temperature will be 86°F
(iii) When the temperature is 95°F then, using the equation
y = x + 32
by substituting, y=95, we get
95 = x+ 32
x =
x = 35
Hence, in Celsius temperature will be 35°C
(iv)When the temperature is 0°C, using the equation
y = x + 32
by substituting, x=0, we get
y = ×0 + 32
y = 32
Hence, in Fahrenheit temperature will be 32°F
and, when the temperature is 0°F, using the equation and by substituting, y=0, we get
0 = x + 32
x =
x = -17.78
Hence, in Celsius temperature will be -17.78°C.
(v) Lets take both temperature same as x.
so, equation becomes as follows:
x = x + 32
x-x = -32
x = -32
x = -32×
x = -40
Hence, Celsius and Fahrenheit temperature will be -40°C and -40°F respectively.
👁 Image
Understanding and solving linear equations in the two variables is essential for working with the coordinate geometry and solving real-world problems. Exercise 4.3 helps students build problem-solving skills by the practicing how to solve these equations graphically and algebraically. Mastery of this concept will be highly beneficial in the later mathematical studies especially in areas such as the algebra, geometry and calculus.