 |
VOOZH | about |
|
VOOZH | about |
Logarithmic Scale: On a chart, a logarithmic or log scale can be used to present big data or statistics clearly and understandably. Log scale knowledge is essential if you plan to work in an area like computer science, data analysis, research, finance, or business intelligence. It can help you display facts properly at work and boost your confidence.
This article will provide you with an overview of log scales, when to apply them along with examples of how to use the log formula to help you grasp it better.
Table of Content
A logarithmic scale is a way to show and study a wide range of values in a simple, compact way. Unlike regular linear scales, where values increase in equal steps, log scales grow very quickly with large numbers.
Instead of moving up in equal steps, the values on a log scale increase by multiplying with the base of the logarithm at each step. Analysts often use powers of 10 or base e for log scales. In these cases, each value grows by 10 times as you move along the scale.
Instead of progressing by equal increments, the values on a log scale grow by multiplying the previous value by a constant factor. For instance, values may increase by 10, 100, and 1,000.
There are three types of Logarithmic Scales:
Common Logarithmic Scale (Base 10): This scale increases in powers of 10, where each unit change represents a tenfold increase in value, commonly used in finance and science.
Natural Logarithmic Scale (Base e): The base-e logarithmic scale is used when dealing with natural exponential growth, such as in population studies or continuous compounding in finance.
Binary Logarithmic Scale (Base 2): The base-2 logarithmic scale is often used in computer science and data structures where growth is determined by powers of 2.
Using scales can help present large amounts of data in a clear way. This aids analysts, researchers and others in making decisions based on the information. If you're considering using log scales it's crucial to grasp their functionality.
Here are a few key points to remember:
On a scale the values go up by the same increment like 1, 2, 3 and so forth. However on a scale the values increase in powers of a particular number. For instance instead of going up by 1, 2, 3 a logarithmic scale might progress by 10, 100, 1000 and so on.
To illustrate, if a company made 1 sale in 1999 and then doubled its sales annually until 2011 a linear graph would depict the total sales for each year. In contrast a logarithmic scale would highlight the rate of growth in sales over time.
Also Read: Difference Between Linear and Non-Linear Equations
In a log scale, each step grows or shrinks by multiplying the previous value. Here's the formula for finding logarithms to create the scale: y = logₓ
In this formula:
For example, if you use a base-10 scale, the formula becomes:
Also Read: Logarithm and Logarithmic Function.
Follow these steps to read a log scale:
Step 1: Check if the graph is a semi-log (one axis is logarithmic) or a log-log graph (both axes are logarithmic).
Step 2: Look at the major divisions, which are usually based on powers of 10.
Step 3: Keep in mind that the spaces between the numbers aren’t evenly spaced like in a regular graph.
Step 4: Read the smaller intervals, which are based on the logarithmic values for each number.
Here is a list of some common examples of Logarithmic Scales"
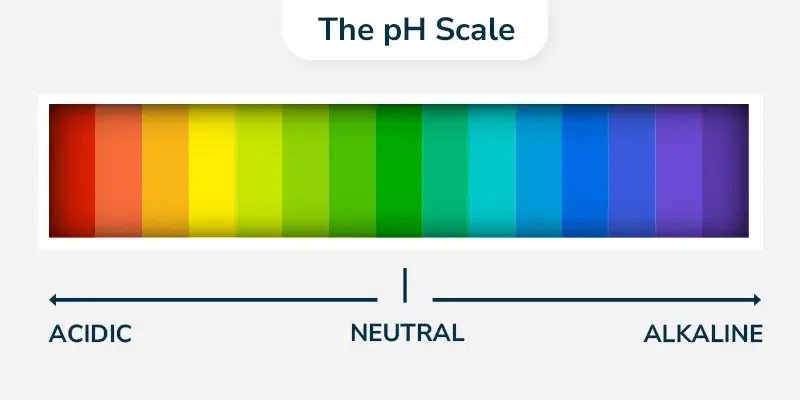
In chemistry, the pH scale measures how acidic or alkaline a substance is. It uses a log scale where each unit change represents a tenfold difference in hydrogen ion concentration. For example, a substance with a pH of 4 is 10 times more acidic than one with a pH of 5, and 100 times more acidic than one with a pH of 6.
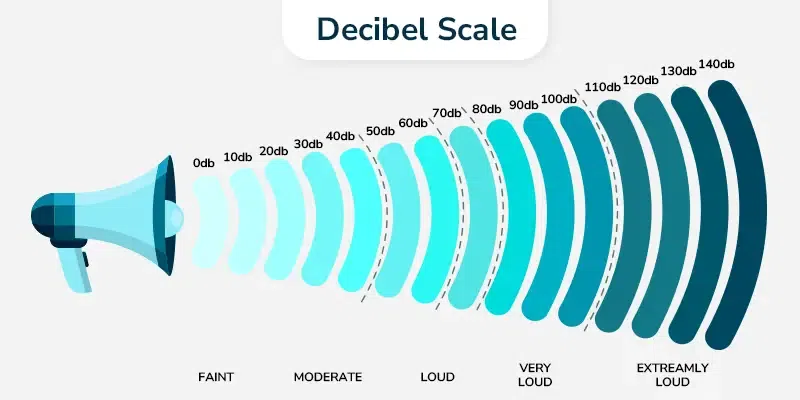
The decibel (dB) system measures sound intensity. It uses a log scale because our ears perceive sound intensity in a non-linear way. For instance, a normal conversation is between 55 and 65 dB, while a whisper is between 20 and 30 dB. The scale decreases exponentially as the sound gets quieter.
The Richter scale measures the magnitude of earthquakes. It’s a log scale because it shows how much energy is released, with each number representing a tenfold increase in amplitude of the seismic waves. For example, an earthquake measuring 7 is much stronger and more destructive than one measuring 5.
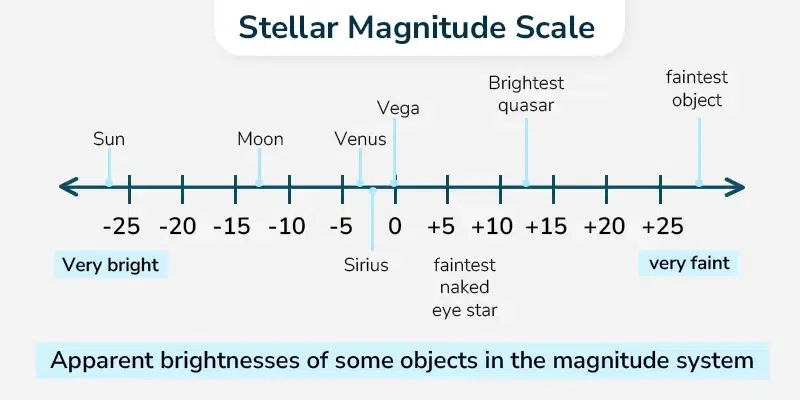
Astronomers use this scale to measure the brightness of stars. The brightest stars have the smallest numbers, and the faintest stars have higher numbers. This log scale helps simplify a vast range of brightness levels, making them easier to compare.
Log scales are helpful when your data has values that are either much bigger or much smaller than others. You can also use a log scale in charts to show big percentage differences between data points. Log scales are typically used when your data covers a wide range, like when showing fast growth.
Here are some fields where log scales are commonly used:
In conclusion, a logarithmic scale is a useful way to represent large ranges of values by compressing them into a more manageable form. It allows us to visualize and compare data that spans several orders of magnitude, such as earthquake magnitudes or sound intensity.
Read More,