 |
VOOZH | about |
|
VOOZH | about |
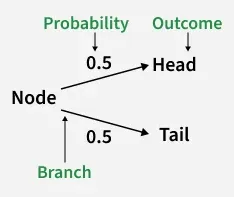
A tree diagram is a graphical presentation that is used in business statistics to solve problems related to probabilities. A tree diagram is composed of nodes and branches.
1. Nodes: Nodes can be classified into parent nodes and sibling nodes.
2. Branches: Branches connect the nodes and display the probability of each outcome occurring.
👁 nodeFor a coin flip, the parent node is the event of flipping the coin. The sibling nodes are heads and tails, each with a probability of 0.5.
To make a probability tree diagram, you need to find all the possible outcomes and their associated probabilities. Follow these steps:
Step 1: Decide if the events depend on each other or happen independently.
Step 2: Draw branches to show the initial outcomes.
Step 3: Put the probabilities for each outcome on its branch.
Step 4: Draw additional branches for the next outcomes, considering if events are dependent or independent. Include the associated probabilities.
Step 5: Repeat step 4 as needed.
Step 6: To find the total probability, multiply the probabilities along the branches. The sum of these probabilities should always be 1.
For example, on rolling a six-sided die:
- The events are independent.
- Draw branches for each number (1 through 6).
- Write the probability of each number on its branch (1/6 for each).
- Draw branches for the second roll, and write the associated probabilities (again, 1/6 for each).
- Repeat if needed for more rolls.
- Multiply the probabilities along the branches to get the overall probability.
- The total of all probabilities should be 1.
A conditional probability tree diagram helps show the outcomes of events that depend on each other. Dependent events are influenced by previous occurrences.
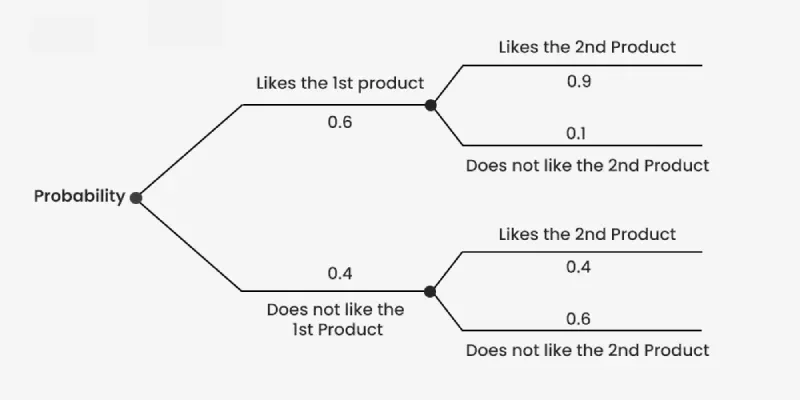
For example, imagine a person buying two different products online. The probability of them liking the first product is 0.6. If they like the first product, the chance they'll also like the second one is 0.9. However, if they don't like the first product, the probability of liking the second one drops to 0.4. To find the conditional probability of disliking both products, we can use a probability tree diagram with these steps:
Step 1: Draw the probability tree diagram for the first product. The probability of disliking it is 1 - 0.6 = 0.4.
Step 2: Create branches for the second product, assuming the person liked the first. Ensure the probabilities sum up to 1 (e.g., 0.9 + 0.1).
Step 3: Draw branches for the second product when the person didn't like the first.
Step 4: Multiply the probabilities along each branch to find the conditional probability of outcomes.
In probability theory, a tree diagram is a tool used to represent a probability space. These diagrams can illustrate sequences of independent events, such as a series of coin tosses, or conditional probabilities, like drawing cards from a deck without replacement.
1. Purpose: Tree diagrams help express the likelihood of different outcomes in a systematic way.
2. Components:
3. Application: Tree diagrams are especially helpful when dealing with complex probability scenarios. They provide a visual and structured approach to understanding the probabilities associated with various events.
4. Calculation Aid: When calculating probabilities becomes challenging, the tree diagram serves as a valuable tool. It breaks down the sequence of events and makes it easier to determine the probabilities at each stage.
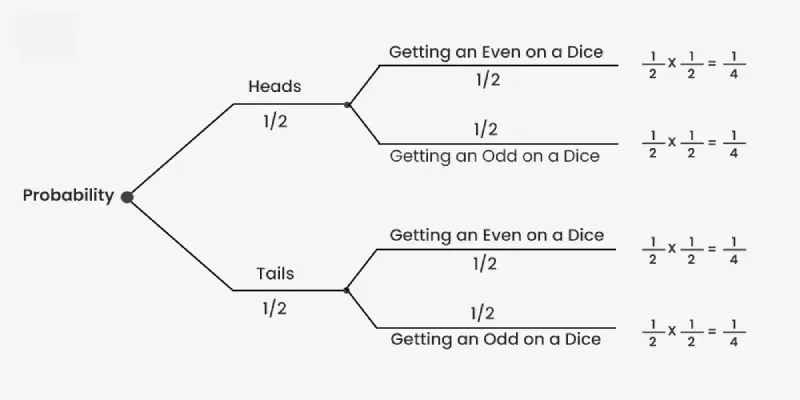
Example 1: You toss a fair coin and then roll a six-sided die. Represent this scenario using a tree diagram and find the probability of getting tails on the coin and an even number on the die.
Create a tree diagram to show the possible outcomes of the coin toss and the dice roll. Assign probabilities to each branch. The probability of getting tails on the coin is , and the probability of getting heads is also . The probability of rolling an even number on the dice is , and the probability of rolling an odd number is .
Calculate the probability of the specific event (getting tails on the coin and an even number on the die) by multiplying the probabilities along the path,
P (Tails and Even) = P(Tails) × P(Even/Tails)
P (Tails and Even) =
P (Tails and Even) =
∴ The probability of getting tails on the coin and an even number on the die is .
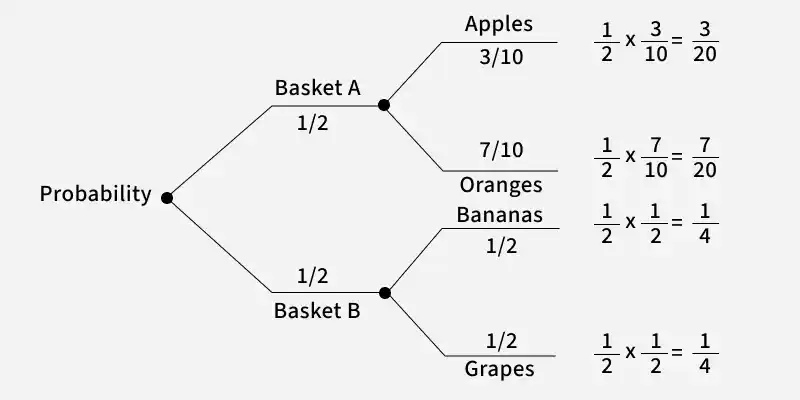
Example 2: Suppose there are two baskets, Basket A and Basket B. In Basket A, there are apples and oranges in the ratio of 3:7. Basket B contains bananas and grapes in the ratio of 1:1. If you first randomly choose a basket and then randomly select a fruit from the chosen basket, create a probability tree diagram representing this scenario. Find the probability of selecting an apple from Basket A and a grape from Basket B.
Probability of Choosing Basket A =
Probability of Choosing an Apple from Basket A =
Probability of Choosing an Orange from Basket A =
Probability of Choosing Basket B =
Probability of Choosing a banana from Basket B =
Probability of Choosing a grape from Basket B =
The required probability of choosing an apple from basket A =
The required probability of choosing a grape from basket B =
Hence, the probability of selecting an apple from basket A and a grape from basket B =