 |
VOOZH | about |
|
VOOZH | about |
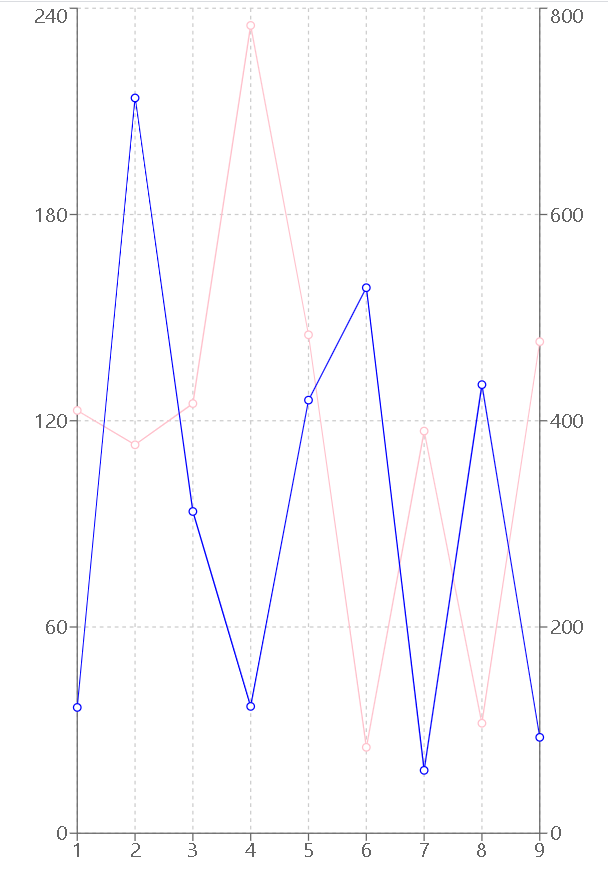
Y-axis Rechart JS is a library Reactused for creating charts for React JS. This library is used for building Line charts, Bar charts, Pie charts, etc, with the help of React and D3 (Data-Driven Documents).
Approach: To create a Biaxial Line chart in React using recharts, we first React and two Y-Axis. Also, add y-axisId to both Y-Axis to the be referenced while plotting the Line chart. Finally, point the line chart around using the Line component from recharts npm package.
Step 1: Create a React application using the following command.
npx create-react-app foldername
Step 2: After creating your project folder i.e. folder name, move to it using the following command.
cd foldername
Step 3: After creating the ReactJS application, Install the required modules using the following command.
npm install --save recharts
Project Structure:
👁 ImageThe updated dependencies in package.json file will look like.
 "dependencies": {
 "react": "^18.2.0",
 "react-dom": "^18.2.0",
 "react-scripts": "5.0.1",
 "recharts": "^2.10.1",
 "web-vitals": "^2.1.4",
 }
Example 1: Now write down the following code in the App.js file.
Step to Run Application: Run the application using the following command from the root directory of the project:
npm start
Output: Now open your browser and go to http://localhost:3000
Example 2: Now change the following code in the App.js file.
Output: Now open your browser and go to http://localhost:3000