An image histogram is chart representation of the distribution of intensities in an Indexed image or grayscale image. It shows how many times each intensity value in image occurs.
Code #1: Display histogram of an image using MATLAB library function.
Code #2: Display Histogram of an Image without using MATLAB Library function.
Approach :
- Read the source image file into image matrix
- Convert it to grayscale, if it is an RGB image
- Iterate over image matrix and count the frequency of every possible value of intensity
- plot the counted frequency
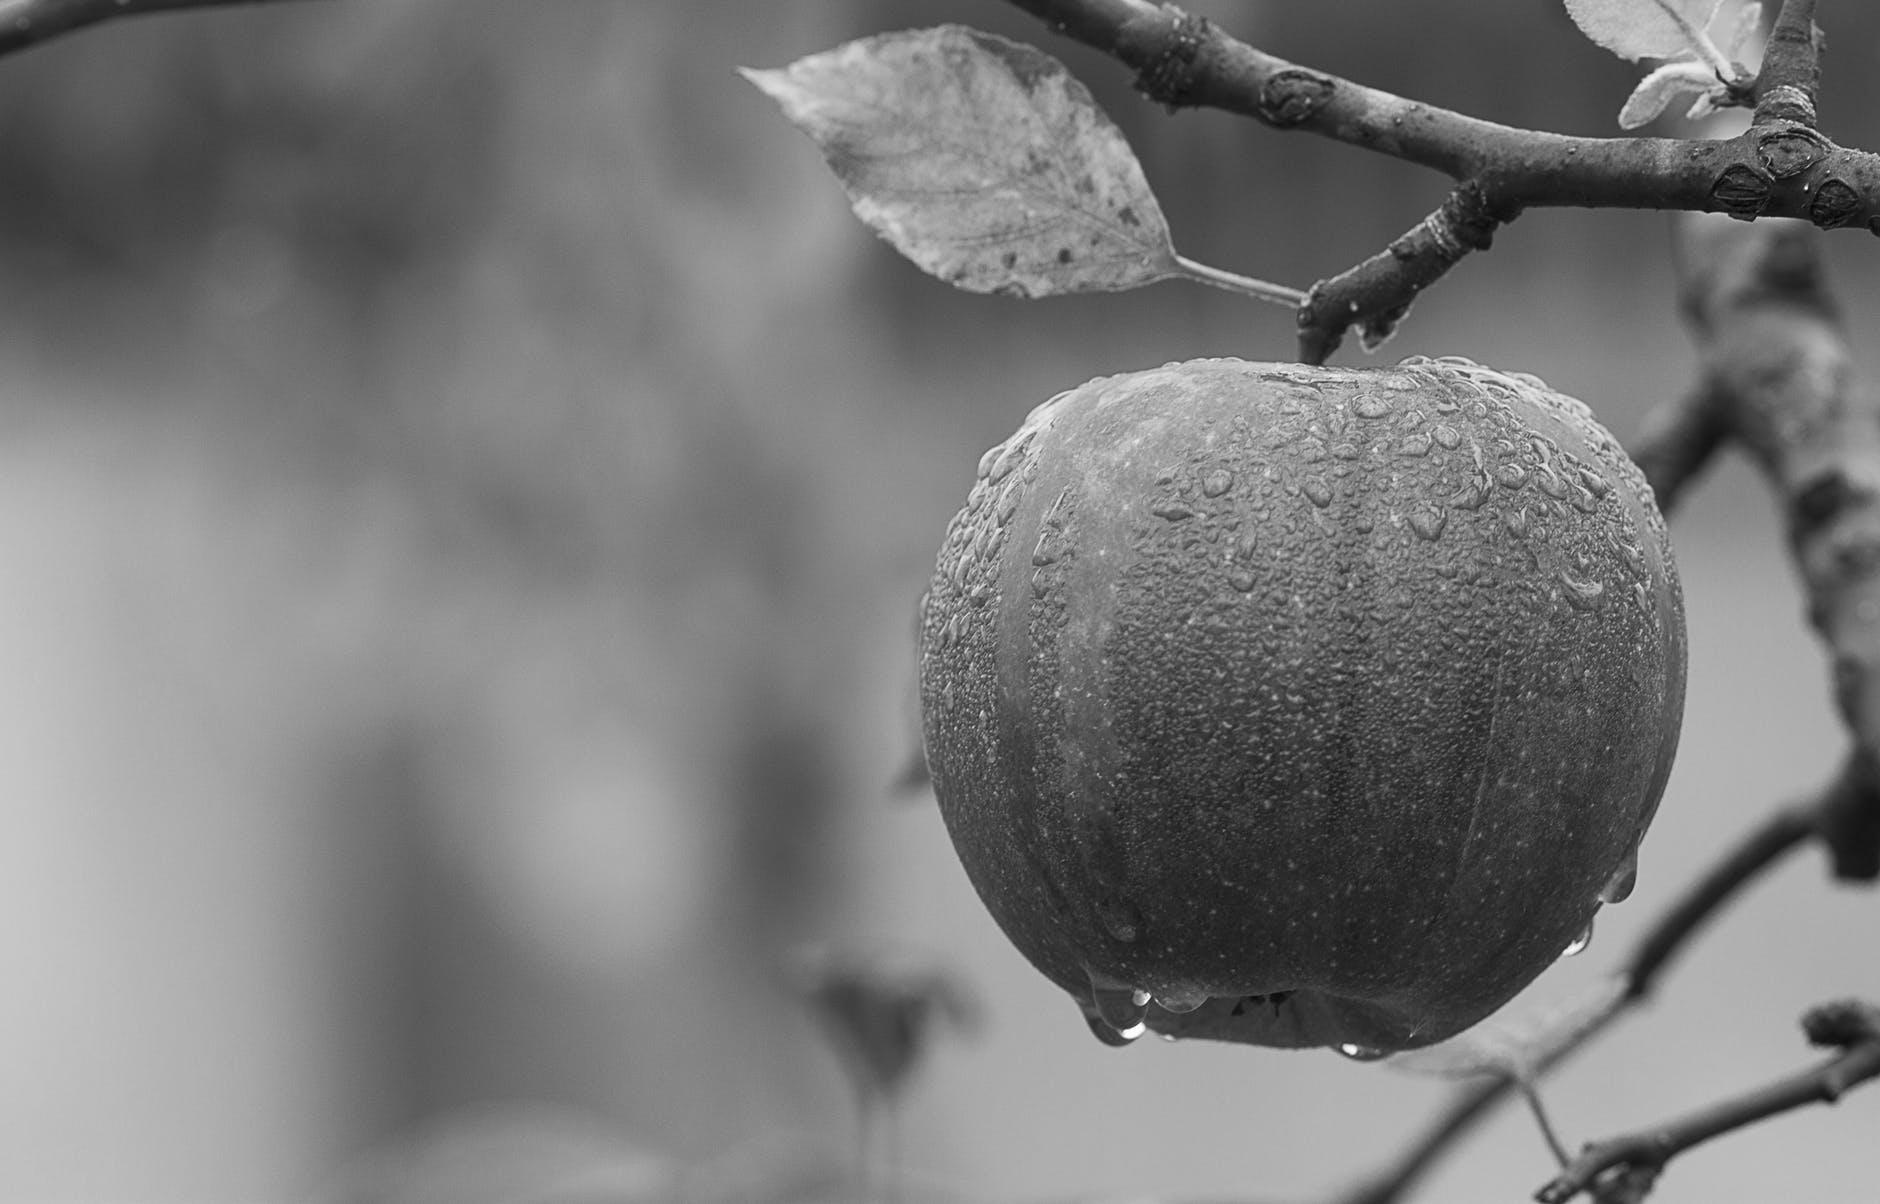
Input:
👁 Input Image
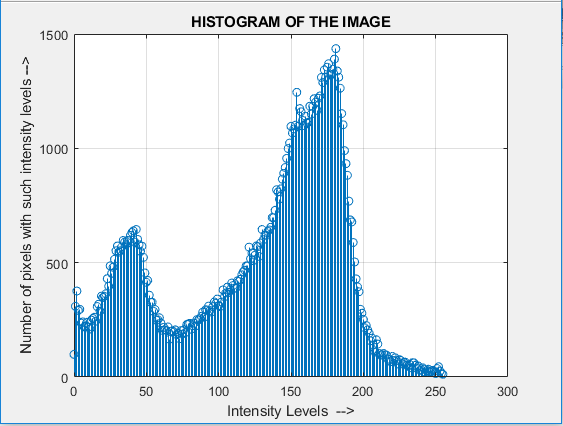
Output:
👁 Histogram