 |
VOOZH | about |
|
VOOZH | about |
The Graphs of trigonometric functions provide a visual representation of how trigonometric functions behave over different intervals. Understanding these graphs is crucial for solving trigonometric equations and analyzing periodic phenomena. This chapter covers the essential techniques to sketch and interpret the graphs of the sine, cosine, and tangent functions providing a foundational understanding of their properties and applications.
Shape: The graph of the sine function is a smooth continuous wave that oscillates between -1 and 1. It has a periodic nature with a period of 2π. The function starts at 0 reaches its maximum at π/2 returns to 0 at π reaches its minimum at 3π/2 and completes the cycle at 2π.
Shape: The cosine function also exhibits a wave-like behavior similar to the sine function but it starts at its maximum value of the 1 when x=0. The graph oscillates between -1 and 1 with the same periodicity of 2π. It has a phase shift of the π/2 compared to the sine function.
Shape: The tangent function has a distinctive shape with the vertical asymptotes where the function approaches infinity. The period of the tangent function is π and it repeats its pattern between each pair of asymptotes. The function passes through the origin and increases or decreases without the bound as it approaches the vertical asymptotes.
Shape: The cotangent function is the reciprocal of the tangent function. It has vertical asymptotes where the tangent function is zero. The graph of the cotangent also has a period of the π but it decreases from the positive to negative infinity between each pair of asymptotes.
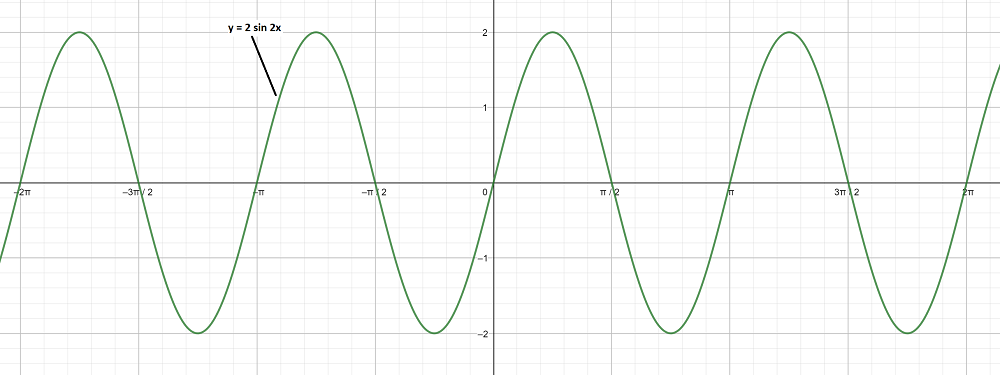
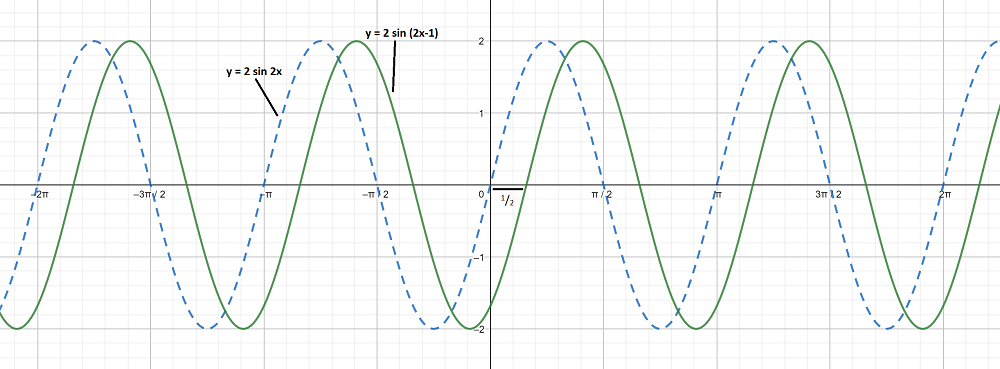
Solution:
To obtain this graph y = 2 sin 2x,
First we draw the graph of y = sin x and then divide the x-coordinates of the points where it crosses x-axis by 2.
👁 ImageThe maximum and minimum values of y are 2 and -2 respectively.
👁 Image
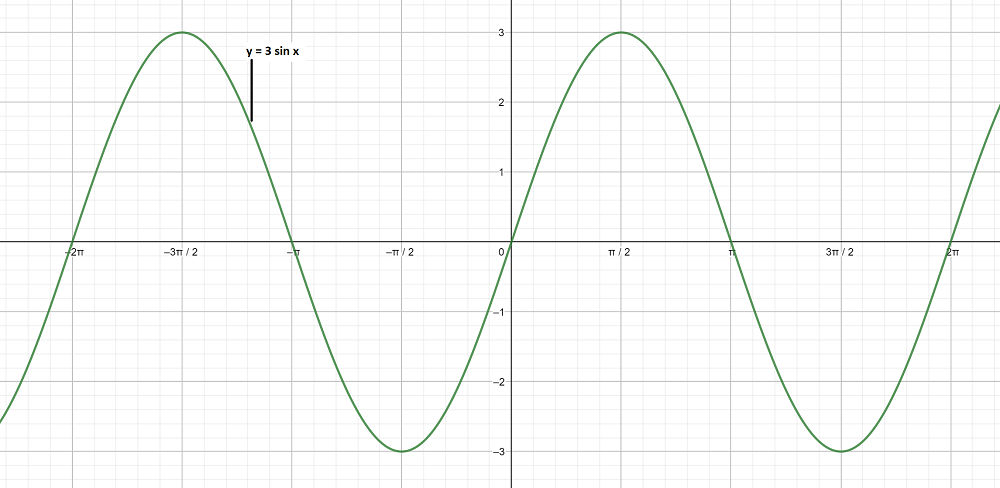
Solution:
To obtain this graph y = 3 sin x,
First we draw the graph of y = sin x.
👁 ImageThe maximum and minimum values of y are 3 and -3 respectively.
👁 Image
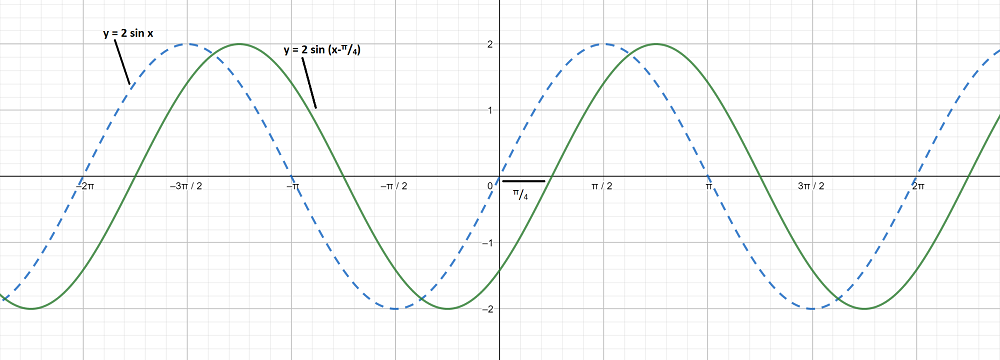
Solution:
To obtain this graph y-0 = ,
On shifting the origin at (π/4, 0), we get
X = and Y = y - 0
On substituting these values, we get
Y = 2 sin X
First we draw the graph of Y = 2 sin X and shift it by π/4 to the right.
👁 Image
Solution:
To obtain this graph y - 0 = 2 sin ,
On shifting the origin at (1/2, 0), we get
X = and Y = y - 0
On substituting these values, we get
Y = 2 sin 2X
First we draw the graph of Y = 2 sin 2X and shift it by 1/2 to the right.
👁 Image
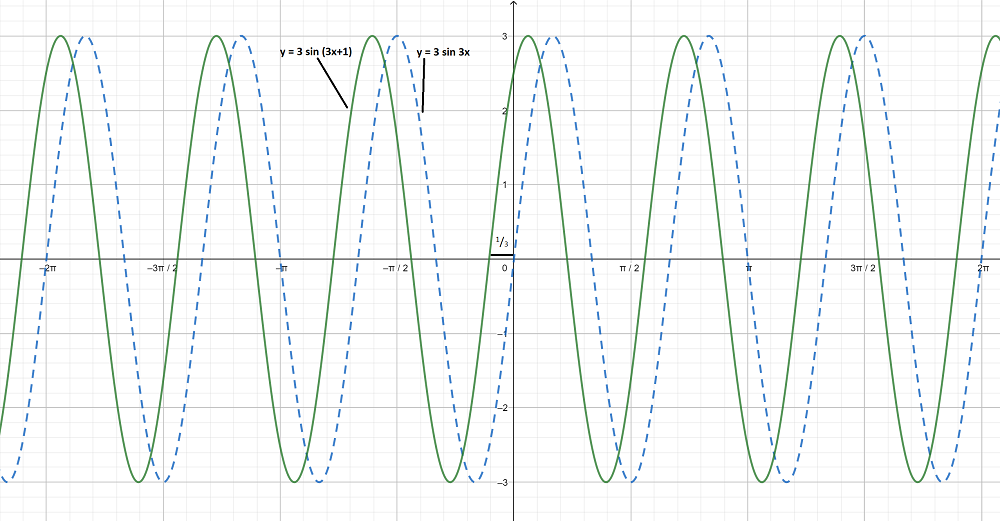
Solution:
To obtain this graph y - 0 = 3 sin 3,
On shifting the origin at(-1/3, 0), we get
X = and Y = y - 0
On substituting these values, we get
Y = 3 sin 3X
First we draw the graph of Y = 3 sin 3X and shift it by 1/3 to the left.
👁 Image
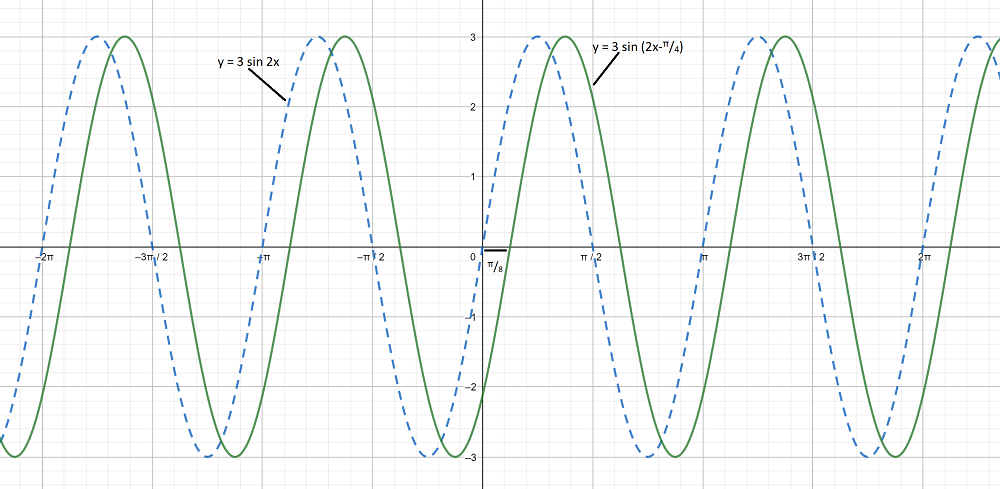
To obtain this graph y-0 =
On shifting the origin at (π/8, 0), we get
X = and Y = y-0
On substituting these values, we get
Y = 3 sin 2X
First we draw the graph of Y = 3 sin 2X and shift it by π/8 to the right.
👁 Image
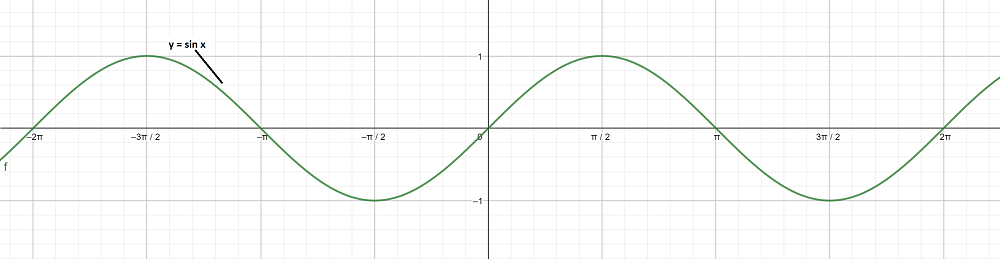
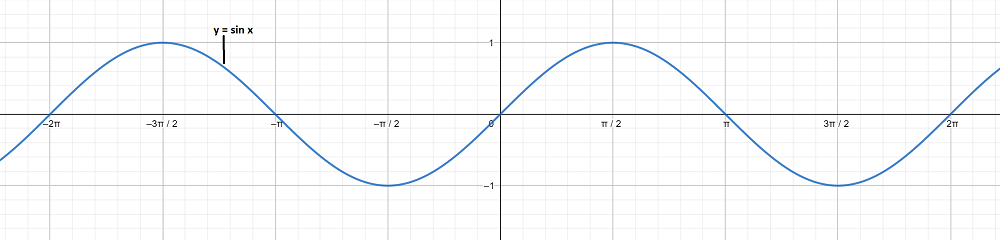
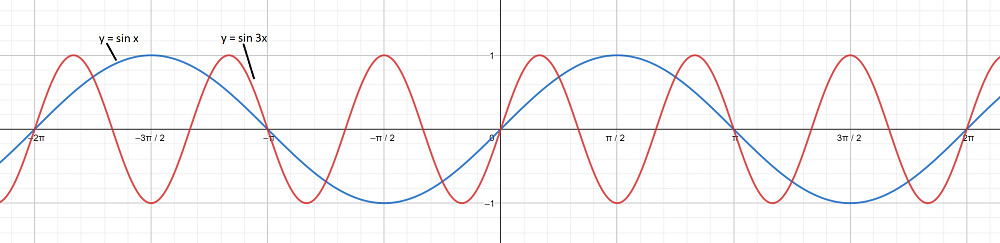
Graph 1:
y = sin x
👁 ImageGraph 2:
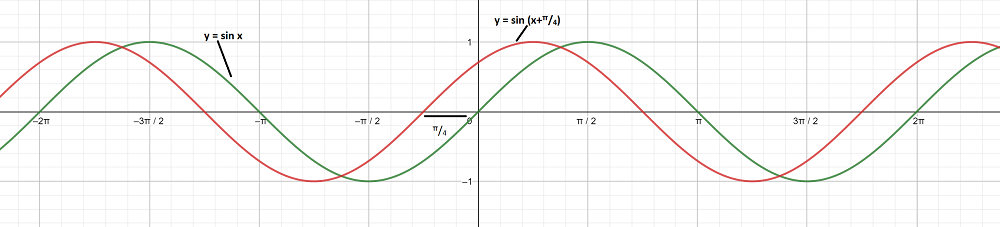
To obtain this graph y-0 =
On shifting the origin at (-π/4, 0), we get
X = and Y = y - 0
On substituting these values, we get
Y = sin X
First we draw the graph of Y = sin X and shift it by π/4 to the left.
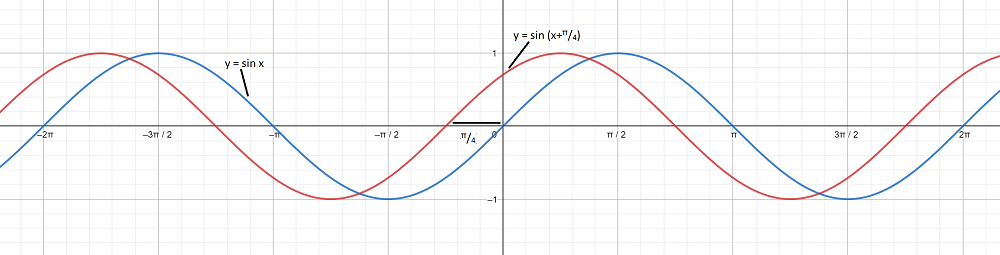
👁 ImageThe graph y = sin x and are on different axes are as follows:
👁 Image
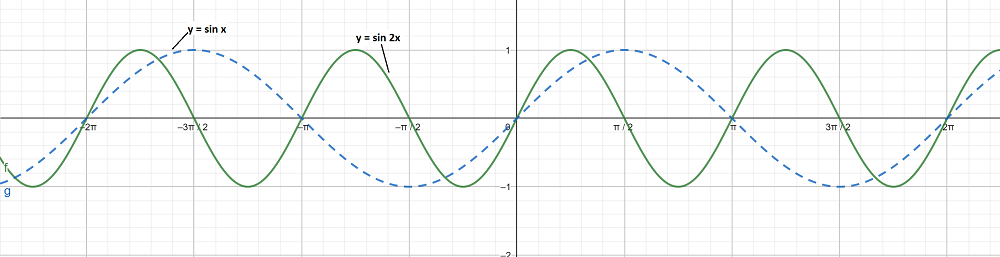
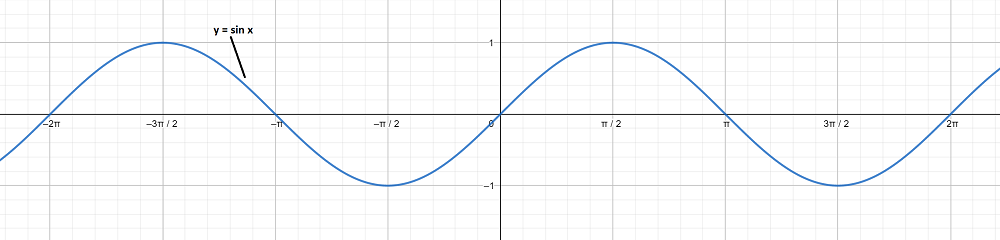
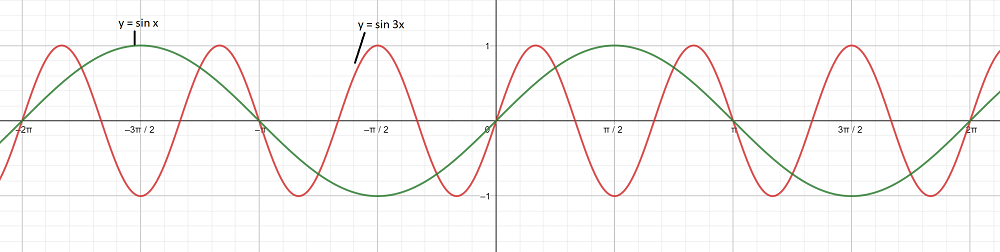
Graph 1:
y = sin x
👁 ImageGraph 2:
To obtain this graph y = sin 3x,
First we draw the graph of y = sin x and then divide the x-coordinates of the points where it crosses x-axis by 3.
👁 ImageThe graph y = sin x and y = sin 3x are on different axes are as follows:
👁 Image