 |
VOOZH | about |
|
VOOZH | about |
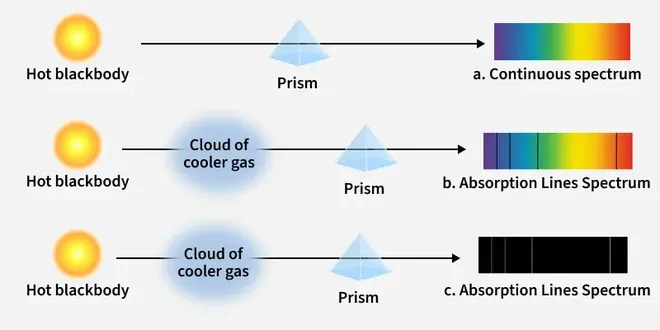
Atomic Spectra refer to the pattern of lines (bright or dark) produced when the light emitted or absorbed by atoms is analyzed through a spectroscope — an instrument that splits light into its component wavelengths so that the spectrum can be observed and studied..
When electrons in an atom move between energy levels, they absorb or emit photons of specific energies. These correspond to particular wavelengths of light, creating a unique spectral pattern for each element.
👁 hot_blackbodyThe three main forms of atomic spectra are:
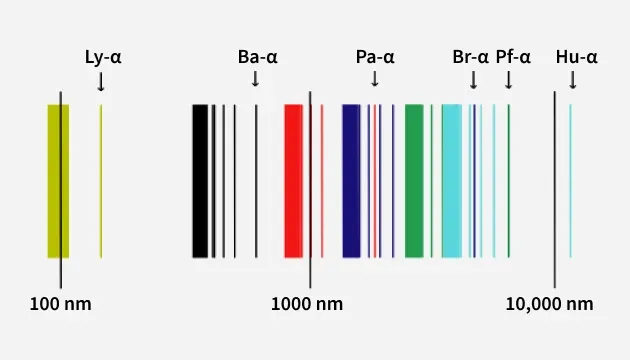
The hydrogen atom provides a clear example of how atomic spectra form. The Rydberg formula relates the wavelengths of spectral lines to electron transitions between energy levels, producing well-known series such as Lyman, Balmer, and Paschen.
Interesting Fact
Every element has its own unique light signature, just like a fingerprint.
By studying these spectral lines, scientists can identify elements present in stars, gases, and chemical samples, and understand how electrons behave within atoms.
Atomic spectroscopy is the study of the electromagnetic radiation emitted or absorbed by atoms. It involves three main types of spectroscopy:
1) Atomic Emission Spectroscopy: This focuses on the transfer of energy from the ground state to an excited state, explaining the electronic transitions when atoms emit light.
2) Atomic Absorption Spectroscopy: This occurs when electrons absorb radiation to transition from a lower energy level to a higher one. It relies on the principle that free electrons in an atomizer can absorb radiation at specific frequencies. The absorption by ground-state atoms in the gaseous phase is measured.
3) Atomic Fluorescence Spectroscopy: This technique combines both atomic emission and absorption, utilizing both excitation and de-excitation radiation.
A spectral series is a sequence of wavelengths emitted or absorbed by energized atoms, arranged in a logical order. The hydrogen atom, being the simplest, produces the most basic spectral lines.
When light passes through a slit into a spectrometer, it forms an image of the source, which can be resolved under the spectroscope. The resulting image is shown as parallel lines with consistent spacing. When moving from the higher to lower wavelength side, the lines are farther apart at the higher wavelength end and eventually converge. The shortest wavelength corresponds to the fewest separated spectral lines, known as the series limit.
A hydrogen atom is made up of several line spectrum series, including:
Bohr's atomic model effectively explains the set of energy levels (states) within an atom. These energy states are represented by quantum numbers (n = 1, 2, 3, 4, 5, 6,...). When an electron transitions from a higher energy state (nh) to a lower energy state (nl), a photon with energy E = h( 1/n2h-1/n2l) is emitted. As the energy associated with each state is fixed, the energy difference between them remains constant, producing a photon of the same energy during each transition.
These transitions divide the spectral series into equivalent series, with the spectral lines being separated using Greek letters to represent transitions between corresponding energy levels. Below are the key spectral series in hydrogen:
Energy level (n) | Wavelength (in nm) in vacuum |
|---|---|
∞ | 91.175 |
6 | 93.78 |
5 | 94.974 |
4 | 97.256 |
3 | 102.57 |
2 | 121.57 |
Energy level (n) | Wavelength (in nm) in air |
|---|---|
∞ | 364.6 |
7 | 397.0 |
6 | 410.2 |
5 | 434.0 |
4 | 486.1 |
3 | 656.3 |
| Energy level (n) | Wavelength (in nm) in air |
|---|---|
∞ | 820.4 |
8 | 954.6 |
7 | 1005 |
6 | 1094 |
5 | 1282 |
4 | 1875 |
Energy level (n) | Wavelength (in nm) in air |
|---|---|
∞ | 1458 |
9 | 1817 |
8 | 1944 |
7 | 2166 |
6 | 2625 |
5 | 4051 |
Energy level (n) | Wavelength (in nm) in vacuum |
|---|---|
∞ | 2279 |
10 | 3039 |
9 | 3297 |
8 | 3741 |
7 | 4654 |
6 | 7460 |
Energy level (n) | Wavelength (in μm) in vacuum |
|---|---|
∞ | 3.282 |
11 | 4.673 |
10 | 5.129 |
9 | 5.908 |
8 | 7.503 |
7 | 12.37 |