 |
VOOZH | about |
|
VOOZH | about |
DBSCAN is a clustering algorithm that groups closely packed points and marks low-density points as outliers. It does not require a predefined number of clusters and can detect clusters of arbitrary shapes. Using scikit-learn, it is used to identify clusters and detect noise in data.
Here we implement the DBSCAN clustering algorithm on a moon-shaped dataset using Scikit-learn and visualize the results.
Import necessary libraries numpy for numerical operations, matplotlib.pyplot for visualization, make_moons to create a sample dataset, DBSCAN for clustering and NearestNeighbors to estimate distances for epsilon.
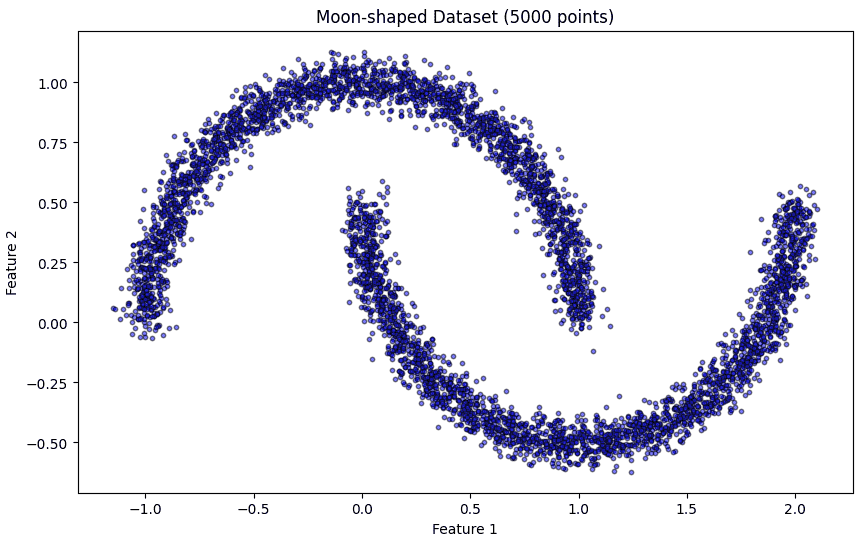
Here we generate a 2D moon-shaped dataset with 5000 points and some noise.
Before clustering, we plot the dataset to understand its structure. Smaller markers and semi-transparency help in visualizing large datasets clearly.
Output:
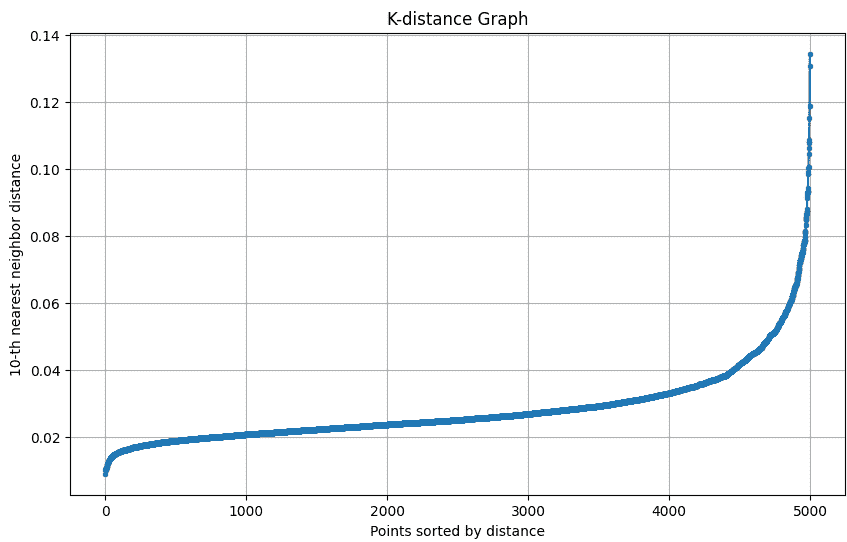
The k-distance graph shows the distance of each point to its k-th nearest neighbor. The “elbow” of this graph helps in selecting the optimal epsilon (eps) for DBSCAN.
The k-distance graph plots each point’s distance to its k-th nearest neighbor to help choose the optimal epsilon for DBSCAN.
Output:
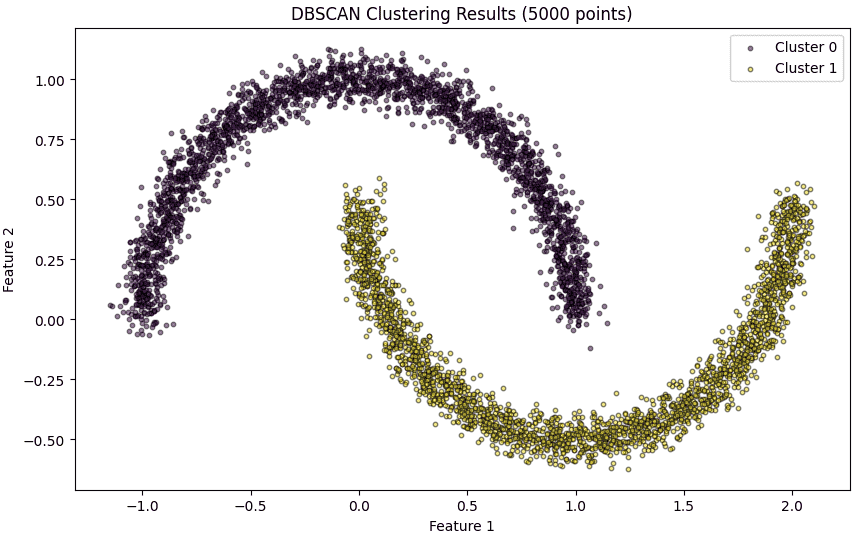
Here we apply DBSCAN on the dataset with the chosen eps and min_samples. DBSCAN automatically identifies clusters of varying shapes and sizes and labels noise points as -1.
Plot each cluster with a unique color. Noise points are highlighted in red. Smaller marker size and transparency make the visualization clear for 5000 points.
Output:
Here we summarize the number of clusters detected by DBSCAN and the points that were classified as noise.
Output:
Number of clusters found: 2
Number of noise points: 0
Download full code from here.