 |
VOOZH | about |
|
VOOZH | about |
In the frequency analysis of time series models, a common model is a sinusoidal wave:
where, ∝ is the amplitude, phi is the phase shift and omega is the dominant frequency. The goal of the complex demodulation plot is to improve the frequency estimate.
The complex demodulation plots formed by two components:
The non-linear fitting for the sinusoidal waves
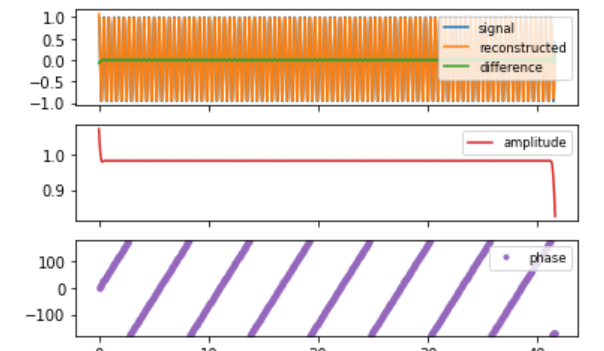
The above equation is sensitive to good initial values. The initial value of frequency omega can be obtained by the spectral plot. The complex demodulation phase plot is used to assess whether this estimate is adequate. If the estimate is not adequate then whether it should be increased and decreased.
In the frequency analysis of time series models, a common model is a sinusoidal wave:
where, ∝ is the amplitude, phi is the phase shift and omega is the dominant frequency.
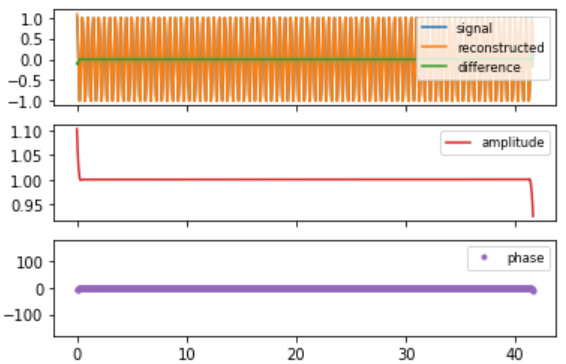
If the slope of the complex demodulation amplitude plot is not zero, then the above equation is finally replaced by the model.
where, ai is some type of linear model fit with standard least squares. The most common case is linear fit, that is the model becomes as follows:
The complex demodulation amplitude plot is formed by
The complex amplitude demodulation plot answers the following questions: