To get the optimal number of clusters in a dataset, we use Gap Statistics. It compares the performance of clustering algorithms against a null reference distribution of the data, allowing for a more objective decision on the number of clusters.
Let’s explore Gap Statistics in more detail and discover how it can help us determine the optimal number of clusters for our data.
What is Gap Statistic?
In K-means, choosing the right number of clusters is important because it can greatly impact the results. The Gap Statistic helps solve this problem by comparing how much the data within each cluster varies for different numbers of clusters (k).
Gap Statistic compares how well the clusters formed from your actual data stand out against what you would expect if the data were randomly distributed. In other words, it looks at how tightly packed your real clusters are compared to clusters created from random data. This helps us understand if the patterns we see in our data are meaningful or just due to chance
Why we use Gap Statistic?
The Gap Statistic provides a more objective basis for determining the optimal number of clusters compared to subjective methods like trial-and-error or guesswork. By statistically assessing how well-defined your clusters are against random distributions, you can make informed decisions that enhance model performance.
How Does the Gap Statistic Work?
Clustering the Data: Perform clustering on the actual data using a clustering algorithm, such as k-means, for a range of potential cluster numbers (k).
Create Reference Data: Generate a set of reference datasets by simulating random data with the same distribution and dimensionality as the original dataset. These datasets are assumed to contain no inherent structure (i.e., they are uniformly distributed).
Compute Clustering Performance: For both the actual data and the reference datasets, compute the clustering performance using a cost function, typically the within-cluster sum of squared errors (WSS), also known as inertia in k-means clustering. This measures the compactness of clusters, where lower values indicate better clustering.
Gap Statistic Calculation: The Gap Statistic for each number of clusters k is computed as: Where:
is the WSS for the actual data with k clusters.
is the WSS for the reference data with k clusters.
is the number of reference datasets used.
Selecting the Optimal Number of Clusters: The optimal number of clusters is chosen as the smallest value of k such that: Where is the standard error of the Gap Statistic for k+1 clusters. This condition ensures that the chosen k provides a significant improvement over the random configuration of data.
Optimizing the Number of Clusters in K-Mean Clustering using Gap Statistics
Step 1: Generate Sample Data
The first step is to generate sample data for clustering. We'll use the make_blobsfunction from sklearn.datasets to create a synthetic dataset with 300 samples and 4 centers.
Step 2: Define the Gap Statistic Calculation Function
Next, we define a function to compute the Gap Statistic for a range of cluster numbers. The Gap Statistic compares the clustering result to random data (uniform distribution).
Step 3: Calculate Gap Statistic for Different k Values
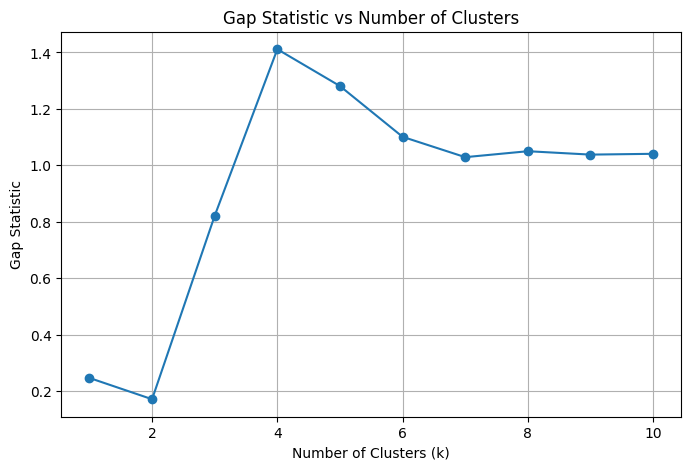
Now that the function is defined, we call it to calculate the Gap Statistic for different values of k (number of clusters). We'll evaluate for a maximum of 10 clusters (k_max = 10).
In this output, we can see the optimal number of output is 3.
Step 4: Determine Optimal k
Once we have the Gap Statistic values, we find the optimal number of clusters based on the maximum gap. We do this by identifying where the gap between consecutive values is the largest.
Output:
Optimal number of clusters: 2
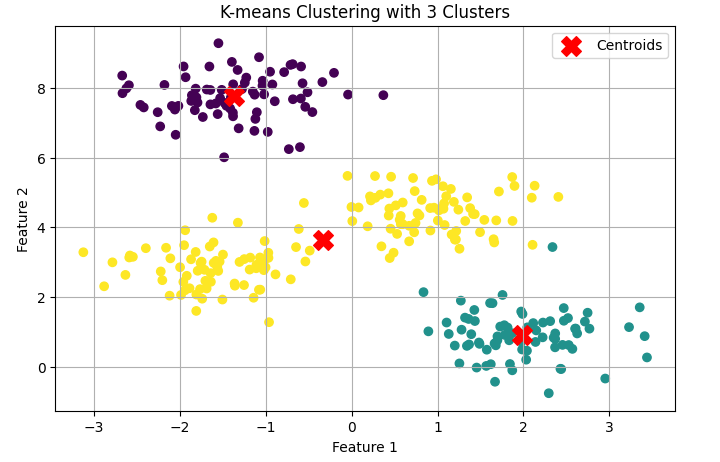
Step 5: Apply K-means with the Optimal k
Once the optimal k is identified, we apply the K-means clustering algorithm with the selected number of clusters and fit it to the data.
Step 6: Visualize the K-means Clustering Result
Finally, we visualize the clustering results by plotting the data points, coloring them according to their cluster labels. The cluster centroids are also marked.
The Gap Statistic has a strong statistical basis because it compares clustering results with a null reference distribution, making it less prone to the subjective interpretation inherent in methods like the Elbow method.
The method offers a clear and objective criterion for determining the optimal number of clusters, based on the gap between the WSS for the actual and reference data.
The Gap Statistic can be applied to various clustering algorithms, not just k-means, and works well with different types of data distributions.
Limitations of Gap Statistic
Generating reference datasets and calculating WSS for multiple values of k can be computationally intensive, especially for large datasets.
The accuracy of the Gap Statistic depends on the quality and size of the reference data, which can affect the results.
The method assumes that the clustering algorithm chosen is appropriate for the data. The performance of the Gap Statistic can vary with different clustering methods.
