 |
VOOZH | about |
|
VOOZH | about |
The development of precise models is essential for predicted performance in the rapidly developing area of machine learning. The possibility of overfitting, in which a model picks up noise and oscillations unique to the training set in addition to the underlying patterns in the data, presents an inherent problem. As a potent weapon against overfitting, feature selection offers a way to improve the efficiency and generality of the model.
When a machine learning model learns all the intricacies and noise in the training data to the point where it adversely affects the model's performance on new data, this is known as overfitting. The reason for this is that the model is very complicated in comparison to the volume and noise level of the training data. Poor generalization can result from overfitting, which happens when a model is too adaptive and fits the training data exactly—including noise. In addition, the model may be able to memorize the training data rather than understand the underlying patterns if it has too many parameters in comparison to the number of observations in the training set.
Feature selection is the process of selecting a subset of relevant features (variables, predictors) for use in model construction. The goal of feature selection is to improve the model's performance by reducing overfitting, increasing model interpretability, and reducing computational complexity.
Feature selection can reduce overfitting by simplifying the model and focusing on the most relevant features. Here's how it helps:
Overall, feature selection helps reduce overfitting by simplifying the model, preventing the memorization of noise, and focusing on the most relevant features, leading to better generalization and improved performance.
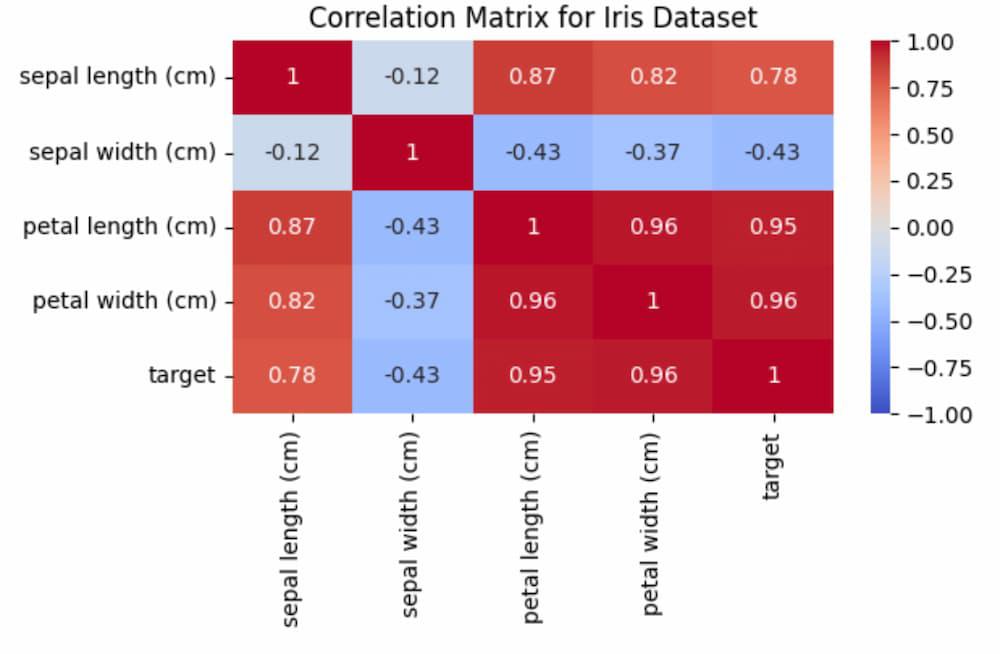
X variable contains the features (sepal length, sepal width, petal length, petal width) of the flowers, and the y variable contains the target labels (species of iris). train_test_split function is used to split the data, where 70% of the data is used for training (X_train, y_train) and 30% is used for testing (X_test, y_test). random_state parameter is set to 42 to ensure reproducibility of the split.Using correlation is a common technique to identify relationships between features in a dataset. It helps in understanding which features are closely related and can potentially be redundant. Here's how you can use correlation:
Output:
Here, we see that with target is mostly correlated with petal length and petal width, thus if we want to get the most important features we can select those too.
If you were to perform feature selection or feature importance analysis on this dataset, selecting petal length and petal width as the most important features could be a reasonable approach based on their high correlation with the target variable. These features provide valuable information for distinguishing between different species of iris.
Here's a brief definition of each of the filter methods:
SelectKBest Selects the top k features based on a scoring function. In this case, k=2 is used to select the top 2 features.
B. SelectPercentile:
Selects the top features based on a percentile of the highest scores. Here, percentile=50 is used to select the top 50% of features.
Recursively removes the least important features until the desired number of features is reached. n_features_to_select=2 is used to select the top 2 features.
Selects features based on a threshold of importance weights computed by an estimator. threshold='mean' is used to select features with importance greater than the mean importance.
Uses feature importances from a Random Forest model as a filter method. Features with importance greater than threshold=0.1 are selected.
Comparing the selected features by different methods
Output:
Selected features using SelectKBest:
[2 3]

Selected features using SelectPercentile:
[2 3]

Selected features using RFE:
[2 3]

Selected features using SelectFromModel:
[2 3]

Selected features using Random Forest correlations:
[2, 3]
The selected features using different methods are the same, which indicates that all methods agree on the importance of features 2 and 3. Features in the Iris dataset correspond to petal length and petal width, which are known to be highly informative for iris species classification.